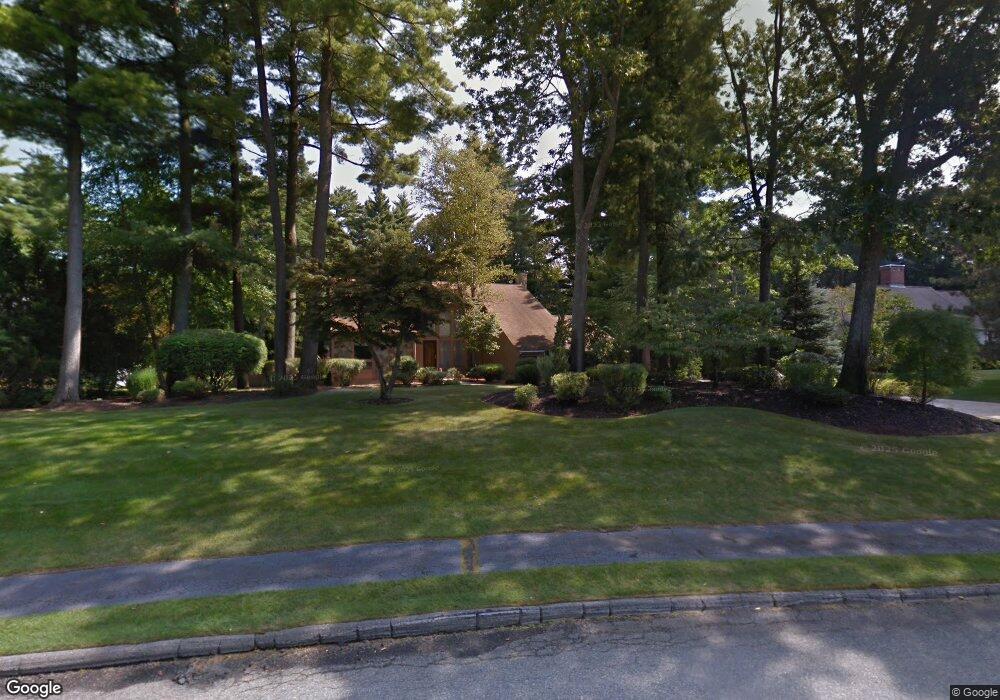
10 Wymon Way Lynnfield, MA 01940
Estimated Value: $1,540,000 - $1,817,000
3
Beds
4
Baths
3,600
Sq Ft
$470/Sq Ft
Est. Value
About This Home
This home is located at 10 Wymon Way, Lynnfield, MA 01940 and is currently estimated at $1,693,588, approximately $470 per square foot. 10 Wymon Way is a home located in Essex County with nearby schools including Lynnfield Middle School, Pickering Middle School, and Lynnfield High School.
Ownership History
Date
Name
Owned For
Owner Type
Purchase Details
Closed on
Oct 31, 2007
Sold by
Pescione Armand L and Pescione Lisa Ann
Bought by
Gaonkar Sameer and Mallick Sangita
Current Estimated Value
Purchase Details
Closed on
Apr 16, 2003
Sold by
Pescione Armand L
Bought by
Pescione Armand L
Purchase Details
Closed on
Nov 13, 1996
Sold by
Piantedosi Robert
Bought by
Pescione Armand L
Create a Home Valuation Report for This Property
The Home Valuation Report is an in-depth analysis detailing your home's value as well as a comparison with similar homes in the area
Home Values in the Area
Average Home Value in this Area
Purchase History
| Date | Buyer | Sale Price | Title Company |
|---|---|---|---|
| Gaonkar Sameer | $1,005,000 | -- | |
| Pescione Armand L | -- | -- | |
| Pescione Armand L | $470,000 | -- |
Source: Public Records
Mortgage History
| Date | Status | Borrower | Loan Amount |
|---|---|---|---|
| Open | Pescione Armand L | $622,000 | |
| Closed | Pescione Armand L | $643,100 |
Source: Public Records
Tax History Compared to Growth
Tax History
| Year | Tax Paid | Tax Assessment Tax Assessment Total Assessment is a certain percentage of the fair market value that is determined by local assessors to be the total taxable value of land and additions on the property. | Land | Improvement |
|---|---|---|---|---|
| 2025 | $14,702 | $1,392,200 | $712,400 | $679,800 |
| 2024 | $14,237 | $1,354,600 | $691,600 | $663,000 |
| 2023 | $13,748 | $1,216,600 | $612,600 | $604,000 |
| 2022 | $13,061 | $1,089,300 | $573,100 | $516,200 |
| 2021 | $12,254 | $923,400 | $434,900 | $488,500 |
| 2020 | $12,326 | $885,500 | $395,400 | $490,100 |
| 2019 | $12,317 | $885,500 | $395,400 | $490,100 |
| 2018 | $12,184 | $885,500 | $395,400 | $490,100 |
| 2017 | $11,532 | $836,900 | $375,700 | $461,200 |
| 2016 | $11,081 | $764,200 | $361,900 | $402,300 |
| 2015 | $10,526 | $726,400 | $361,500 | $364,900 |
Source: Public Records
Map
Nearby Homes