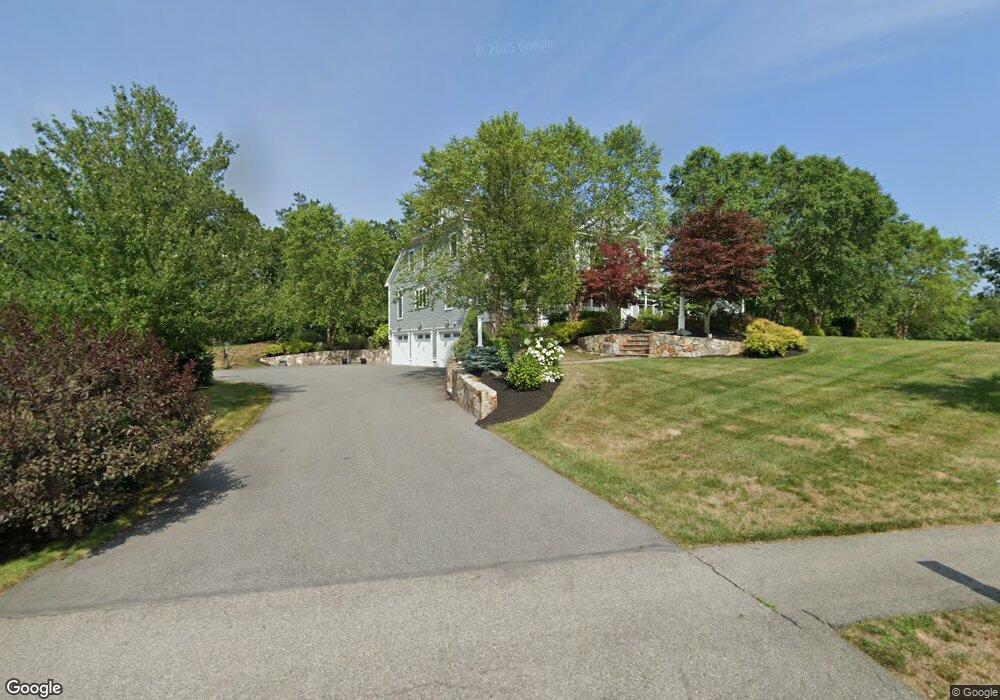
10 Zaloga Way Middleton, MA 01949
Estimated Value: $1,173,000 - $1,622,000
4
Beds
4
Baths
3,324
Sq Ft
$434/Sq Ft
Est. Value
About This Home
This home is located at 10 Zaloga Way, Middleton, MA 01949 and is currently estimated at $1,443,996, approximately $434 per square foot. 10 Zaloga Way is a home located in Essex County with nearby schools including Howe-Manning Elementary School, Fuller Meadow Elementary School, and Masconomet Regional Middle School.
Ownership History
Date
Name
Owned For
Owner Type
Purchase Details
Closed on
Nov 24, 2014
Sold by
Ryebrooke Llc
Bought by
Gillespie Craig J and Gillespie Nicolina
Current Estimated Value
Purchase Details
Closed on
Dec 18, 2009
Sold by
Ryebrooke Llc
Bought by
Gillespie Craig J
Create a Home Valuation Report for This Property
The Home Valuation Report is an in-depth analysis detailing your home's value as well as a comparison with similar homes in the area
Home Values in the Area
Average Home Value in this Area
Purchase History
| Date | Buyer | Sale Price | Title Company |
|---|---|---|---|
| Gillespie Craig J | $385,000 | -- | |
| Gillespie Craig J | $385,000 | -- | |
| Gillespie Craig J | $385,000 | -- |
Source: Public Records
Mortgage History
| Date | Status | Borrower | Loan Amount |
|---|---|---|---|
| Previous Owner | Gillespie Craig J | $65,000 | |
| Previous Owner | Gillespie Craig J | $670,000 | |
| Previous Owner | Gillespie Craig J | $664,000 | |
| Previous Owner | Gillespie Craig J | $308,000 |
Source: Public Records
Tax History Compared to Growth
Tax History
| Year | Tax Paid | Tax Assessment Tax Assessment Total Assessment is a certain percentage of the fair market value that is determined by local assessors to be the total taxable value of land and additions on the property. | Land | Improvement |
|---|---|---|---|---|
| 2025 | $18,250 | $1,534,900 | $627,000 | $907,900 |
| 2024 | $17,430 | $1,478,400 | $625,000 | $853,400 |
| 2023 | $16,592 | $1,289,200 | $625,000 | $664,200 |
| 2022 | $13,424 | $1,013,100 | $419,800 | $593,300 |
| 2021 | $13,223 | $963,800 | $390,600 | $573,200 |
| 2020 | $12,743 | $935,600 | $356,600 | $579,000 |
| 2019 | $11,917 | $870,500 | $308,600 | $561,900 |
| 2018 | $11,951 | $856,100 | $308,600 | $547,500 |
| 2017 | $11,902 | $853,200 | $312,600 | $540,600 |
| 2016 | $11,948 | $860,200 | $326,600 | $533,600 |
| 2015 | $11,045 | $801,500 | $293,100 | $508,400 |
Source: Public Records
Map
Nearby Homes
- 3 Useadoor St
- 77 Essex St
- 1 Mill Terrace
- 78 Mill St
- 112 Mill St
- 39 Central St
- 47 Maple St Unit A
- 196-200 B1 N Main St
- 49 Maple St Unit B
- 89 Forest St
- 3 Warren Dr
- 123 Forest St
- 10 Oak St
- 1 Overbrook Rd
- 22 Locust St
- 6 Masi Meadow Ln Unit B
- 8 Masi Meadow Ln Unit A
- 67 Fuller Pond Rd
- 1 Mills Point Unit 1
- 2 Tyler Ln