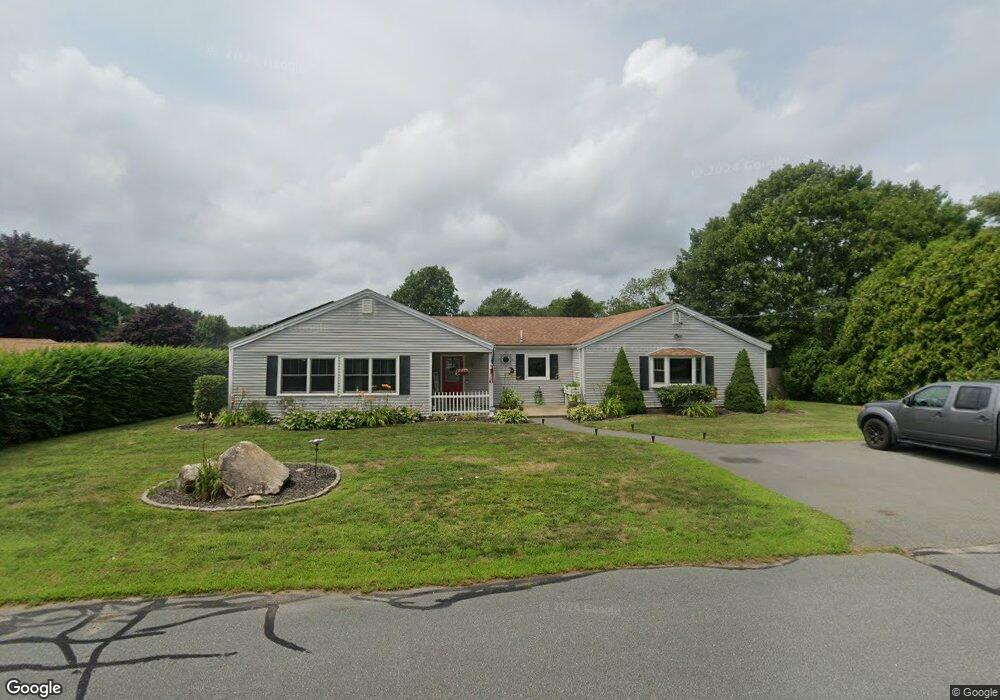
10 Zenas Cowen Ln South Dartmouth, MA 02748
Wilburtie Corner NeighborhoodEstimated Value: $469,000 - $641,000
4
Beds
3
Baths
2,308
Sq Ft
$252/Sq Ft
Est. Value
About This Home
This home is located at 10 Zenas Cowen Ln, South Dartmouth, MA 02748 and is currently estimated at $581,219, approximately $251 per square foot. 10 Zenas Cowen Ln is a home located in Bristol County with nearby schools including Dartmouth High School and Friends Academy.
Ownership History
Date
Name
Owned For
Owner Type
Purchase Details
Closed on
Jun 23, 2015
Sold by
Chaves Carlos and Chaves Natercia
Bought by
Chaves Christopher
Current Estimated Value
Home Financials for this Owner
Home Financials are based on the most recent Mortgage that was taken out on this home.
Original Mortgage
$201,385
Interest Rate
3.78%
Mortgage Type
New Conventional
Purchase Details
Closed on
Feb 25, 2011
Sold by
Brigger Nichole A
Bought by
Chaves Carlos and Chaves Natercia
Purchase Details
Closed on
Feb 14, 2006
Sold by
Blackburn Amy R and Blackburn Tad J
Bought by
Brigger Nichole A
Home Financials for this Owner
Home Financials are based on the most recent Mortgage that was taken out on this home.
Original Mortgage
$298,788
Interest Rate
6.27%
Mortgage Type
VA
Purchase Details
Closed on
Dec 30, 1994
Sold by
Moran Sandra L
Bought by
Blackburn Tod J and Blackburn Amy R
Create a Home Valuation Report for This Property
The Home Valuation Report is an in-depth analysis detailing your home's value as well as a comparison with similar homes in the area
Home Values in the Area
Average Home Value in this Area
Purchase History
| Date | Buyer | Sale Price | Title Company |
|---|---|---|---|
| Chaves Christopher | $220,000 | -- | |
| Chaves Carlos | $219,000 | -- | |
| Brigger Nichole A | $292,500 | -- | |
| Blackburn Tod J | $106,000 | -- |
Source: Public Records
Mortgage History
| Date | Status | Borrower | Loan Amount |
|---|---|---|---|
| Closed | Chaves Christopher | $201,385 | |
| Previous Owner | Blackburn Tod J | $34,000 | |
| Previous Owner | Blackburn Tod J | $298,788 | |
| Previous Owner | Blackburn Tod J | $138,000 |
Source: Public Records
Tax History Compared to Growth
Tax History
| Year | Tax Paid | Tax Assessment Tax Assessment Total Assessment is a certain percentage of the fair market value that is determined by local assessors to be the total taxable value of land and additions on the property. | Land | Improvement |
|---|---|---|---|---|
| 2025 | $3,758 | $436,500 | $138,600 | $297,900 |
| 2024 | $3,665 | $421,800 | $138,600 | $283,200 |
| 2023 | $3,618 | $394,500 | $138,600 | $255,900 |
| 2022 | $3,485 | $352,000 | $138,600 | $213,400 |
| 2021 | $3,477 | $335,600 | $134,600 | $201,000 |
| 2020 | $3,376 | $325,200 | $133,200 | $192,000 |
| 2019 | $3,300 | $317,300 | $127,800 | $189,500 |
| 2018 | $2,993 | $298,400 | $130,500 | $167,900 |
| 2017 | $2,863 | $285,700 | $120,700 | $165,000 |
| 2016 | $2,656 | $261,400 | $106,700 | $154,700 |
| 2015 | $2,600 | $256,400 | $99,700 | $156,700 |
| 2014 | $2,555 | $250,200 | $96,900 | $153,300 |
Source: Public Records
Map
Nearby Homes
- 248 Bakerville Rd
- 34 Country Way
- 75 Country Way Unit 75
- 1150 Russells Mills Rd
- 360 Russells Mills Rd
- 3 Mishawum Dr
- 5 Samosett Dr
- 76 Shipyard Ln
- 61 Pardon Hill Rd
- 14 Westview Dr
- 48 Wilson St
- 10 Westview Dr
- 105 Rock Odundee Rd
- 21 Avis St
- 738 Smith Neck Rd
- 24 White Alder Way
- 6 Jacob Dr
- 212 Rockland St
- Lot 1 Rafael Rd
- 40 School St
- 2 Seth Davis Way
- 1 Louthan Kirby Way
- 4 Seth Davis Way
- 3 Louthan Kirby Way
- 9 Zenas Cowen Ln
- 7 Zenas Cowen Ln
- 11 Zenas Cowen Ln
- 1 Seth Davis Way
- 4 Zenas Cowen Ln
- 4 Louthan Kirby Way
- 5 Louthan Kirby Way
- 6 Seth Davis Way
- 3 Seth Davis Way
- 5 Zenas Cowen Ln
- 6 Louthan Kirby Way
- 15 Zenas Cowen Ln
- 10 Joshua Weeks Ln
- 9 Zena's Cowen
- 5 Seth Davis Way
- 8 Joshua Weeks Ln