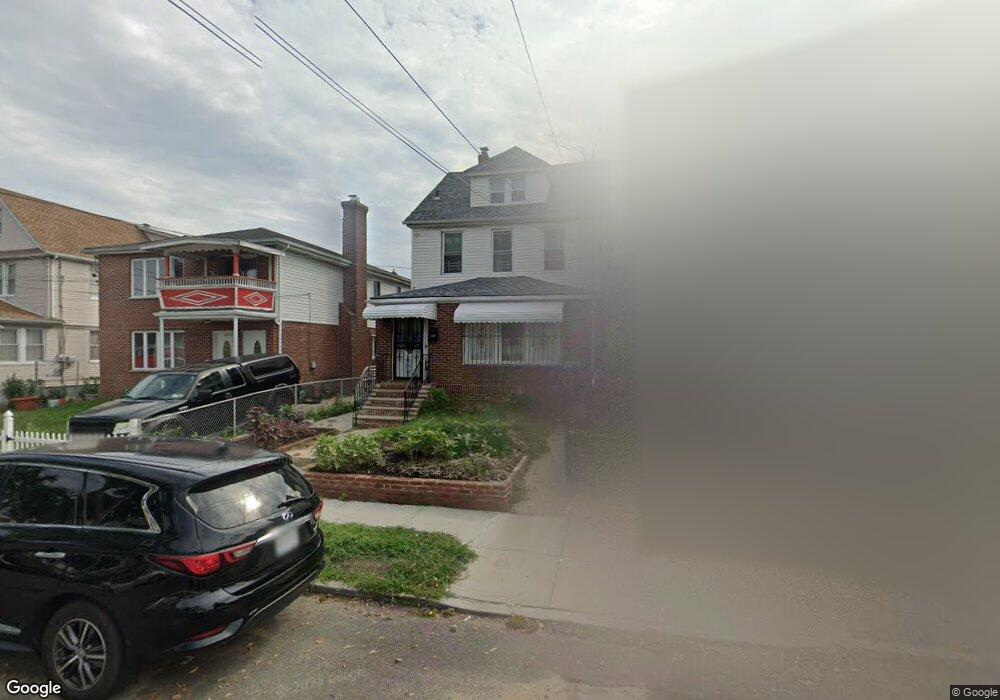
100-19 204th St Hollis, NY 11423
Hollis NeighborhoodEstimated Value: $801,891 - $1,011,000
--
Bed
1
Bath
1,743
Sq Ft
$529/Sq Ft
Est. Value
About This Home
This home is located at 100-19 204th St, Hollis, NY 11423 and is currently estimated at $922,723, approximately $529 per square foot. 100-19 204th St is a home located in Queens County with nearby schools including P.S. 134 Langston Hughes School, I.S. 192 The Linden, and Incarnation Catholic Academy.
Ownership History
Date
Name
Owned For
Owner Type
Purchase Details
Closed on
Jan 27, 2022
Sold by
Kamal Mohammad
Bought by
Begum Ruma and Hasan Emran Md
Current Estimated Value
Home Financials for this Owner
Home Financials are based on the most recent Mortgage that was taken out on this home.
Original Mortgage
$837,809
Outstanding Balance
$775,095
Interest Rate
3.56%
Mortgage Type
Purchase Money Mortgage
Estimated Equity
$147,628
Purchase Details
Closed on
Feb 11, 2020
Sold by
Richard M Gutierrez Esq
Bought by
Kamal Mohammad
Purchase Details
Closed on
Oct 4, 2006
Sold by
Lalloo Lildharry
Bought by
Nazario Anthony
Home Financials for this Owner
Home Financials are based on the most recent Mortgage that was taken out on this home.
Original Mortgage
$130,000
Interest Rate
6.49%
Purchase Details
Closed on
Feb 28, 2005
Sold by
Meier Otto and Wegmuller Beatrice
Bought by
Lalloo Lildharry
Create a Home Valuation Report for This Property
The Home Valuation Report is an in-depth analysis detailing your home's value as well as a comparison with similar homes in the area
Home Values in the Area
Average Home Value in this Area
Purchase History
| Date | Buyer | Sale Price | Title Company |
|---|---|---|---|
| Begum Ruma | $895,000 | -- | |
| Begum Ruma | $895,000 | -- | |
| Begum Ruma | $895,000 | -- | |
| Begum Ruma | $895,000 | -- | |
| Kamal Mohammad | $510,000 | -- | |
| Kamal Mohammad | $510,000 | -- | |
| Kamal Mohammad | $510,000 | -- | |
| Kamal Mohammad | $510,000 | -- | |
| Nazario Anthony | $650,000 | -- | |
| Nazario Anthony | $650,000 | -- | |
| Nazario Anthony | $650,000 | -- | |
| Nazario Anthony | $650,000 | -- | |
| Lalloo Lildharry | $498,000 | -- | |
| Lalloo Lildharry | $498,000 | -- | |
| Lalloo Lildharry | $498,000 | -- | |
| Lalloo Lildharry | $498,000 | -- |
Source: Public Records
Mortgage History
| Date | Status | Borrower | Loan Amount |
|---|---|---|---|
| Open | Begum Ruma | $837,809 | |
| Closed | Begum Ruma | $837,809 | |
| Previous Owner | Nazario Anthony | $130,000 | |
| Previous Owner | Nazario Anthony | $520,000 |
Source: Public Records
Tax History Compared to Growth
Tax History
| Year | Tax Paid | Tax Assessment Tax Assessment Total Assessment is a certain percentage of the fair market value that is determined by local assessors to be the total taxable value of land and additions on the property. | Land | Improvement |
|---|---|---|---|---|
| 2025 | $6,243 | $31,363 | $7,869 | $23,494 |
| 2024 | $6,243 | $31,085 | $8,324 | $22,761 |
| 2023 | $5,890 | $29,327 | $8,443 | $20,884 |
| 2022 | $5,523 | $40,560 | $12,420 | $28,140 |
| 2021 | $5,823 | $35,700 | $12,420 | $23,280 |
| 2020 | $5,532 | $35,520 | $12,420 | $23,100 |
| 2019 | $5,419 | $35,400 | $12,420 | $22,980 |
| 2018 | $4,982 | $24,439 | $9,998 | $14,441 |
| 2017 | $4,700 | $23,056 | $11,363 | $11,693 |
| 2016 | $4,609 | $23,056 | $11,363 | $11,693 |
| 2015 | $2,623 | $21,780 | $13,800 | $7,980 |
| 2014 | $2,623 | $21,587 | $13,678 | $7,909 |
Source: Public Records
Map
Nearby Homes
- 100-35 204th St
- 10035 204th St
- 100-15 202nd St
- 204-20 104th Ave
- 10411 205th St
- 100-28 207th St
- 104-28 201st St
- 99-03 207th St
- 104-38 202nd St
- 204-06 109th Ave
- 93-45 202nd St
- 10411 200th St
- 20202 109th Ave
- 109-10 Francis Lewis Blvd
- 109-12 Francis Lewis Blvd
- 94-72 199th St
- 100-32 199th St
- 109-18 Francis Lewis Blvd
- 208-17 100th Ave
- 93-17 201st St
- 20402 100th Ave
- 10011 204th St
- 20408 100th Ave
- 204-12 100th Ave
- 10015 204th St
- 20412 100th Ave
- 20320 100th Ave
- 10019 204th St
- 10019 204th St Unit 2nd Fl
- 10019 204th St
- 20416 100th Ave
- 10012 205th St
- 100-12 205th St
- 10012 204th St
- 10016 205th St
- 10014 204th St
- 20316 100th Ave
- 10023 204th St
- 10018 204th St
- 10020 205th St