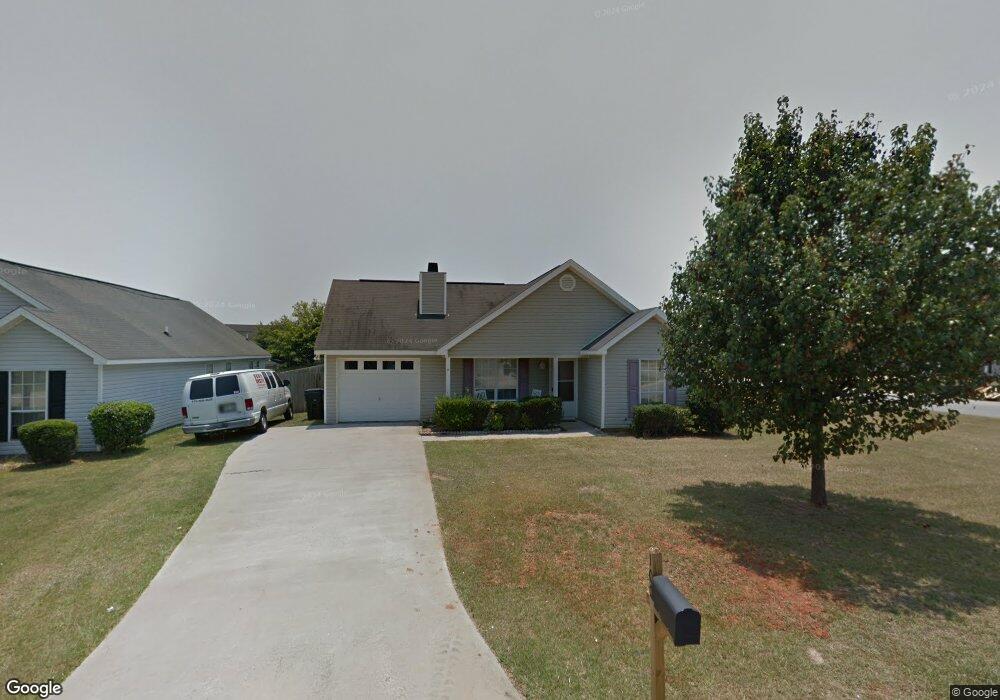
100 Alanwood Ct Warner Robins, GA 31093
Estimated Value: $180,000 - $196,000
3
Beds
2
Baths
1,204
Sq Ft
$156/Sq Ft
Est. Value
About This Home
This home is located at 100 Alanwood Ct, Warner Robins, GA 31093 and is currently estimated at $188,056, approximately $156 per square foot. 100 Alanwood Ct is a home located in Houston County with nearby schools including Quail Run Elementary School, Thomson Middle School, and Northside High School.
Ownership History
Date
Name
Owned For
Owner Type
Purchase Details
Closed on
Apr 24, 2007
Sold by
Drennan Hillary R
Bought by
Brannon Brenda L
Current Estimated Value
Home Financials for this Owner
Home Financials are based on the most recent Mortgage that was taken out on this home.
Original Mortgage
$84,780
Outstanding Balance
$51,119
Interest Rate
6.1%
Mortgage Type
New Conventional
Estimated Equity
$136,937
Purchase Details
Closed on
Jun 22, 2006
Sold by
Molina Carlos J
Bought by
Drennan Hillary R
Home Financials for this Owner
Home Financials are based on the most recent Mortgage that was taken out on this home.
Original Mortgage
$91,675
Interest Rate
6.6%
Mortgage Type
New Conventional
Purchase Details
Closed on
Sep 14, 2001
Sold by
Happel Construction Co
Bought by
Molina Carlos J
Create a Home Valuation Report for This Property
The Home Valuation Report is an in-depth analysis detailing your home's value as well as a comparison with similar homes in the area
Home Values in the Area
Average Home Value in this Area
Purchase History
| Date | Buyer | Sale Price | Title Company |
|---|---|---|---|
| Brannon Brenda L | $94,200 | None Available | |
| Drennan Hillary R | $96,500 | None Available | |
| Molina Carlos J | $80,900 | -- |
Source: Public Records
Mortgage History
| Date | Status | Borrower | Loan Amount |
|---|---|---|---|
| Open | Brannon Brenda L | $84,780 | |
| Previous Owner | Drennan Hillary R | $91,675 |
Source: Public Records
Tax History Compared to Growth
Tax History
| Year | Tax Paid | Tax Assessment Tax Assessment Total Assessment is a certain percentage of the fair market value that is determined by local assessors to be the total taxable value of land and additions on the property. | Land | Improvement |
|---|---|---|---|---|
| 2024 | $1,551 | $53,760 | $8,000 | $45,760 |
| 2023 | $1,412 | $49,200 | $8,000 | $41,200 |
| 2022 | $856 | $46,360 | $8,000 | $38,360 |
| 2021 | $694 | $39,160 | $8,000 | $31,160 |
| 2020 | $635 | $36,480 | $8,000 | $28,480 |
| 2019 | $635 | $36,480 | $8,000 | $28,480 |
| 2018 | $561 | $33,280 | $4,800 | $28,480 |
| 2017 | $561 | $33,280 | $4,800 | $28,480 |
| 2016 | $562 | $33,280 | $4,800 | $28,480 |
| 2015 | -- | $33,440 | $4,800 | $28,640 |
| 2014 | $355 | $33,440 | $4,800 | $28,640 |
| 2013 | $355 | $34,280 | $4,800 | $29,480 |
Source: Public Records
Map
Nearby Homes