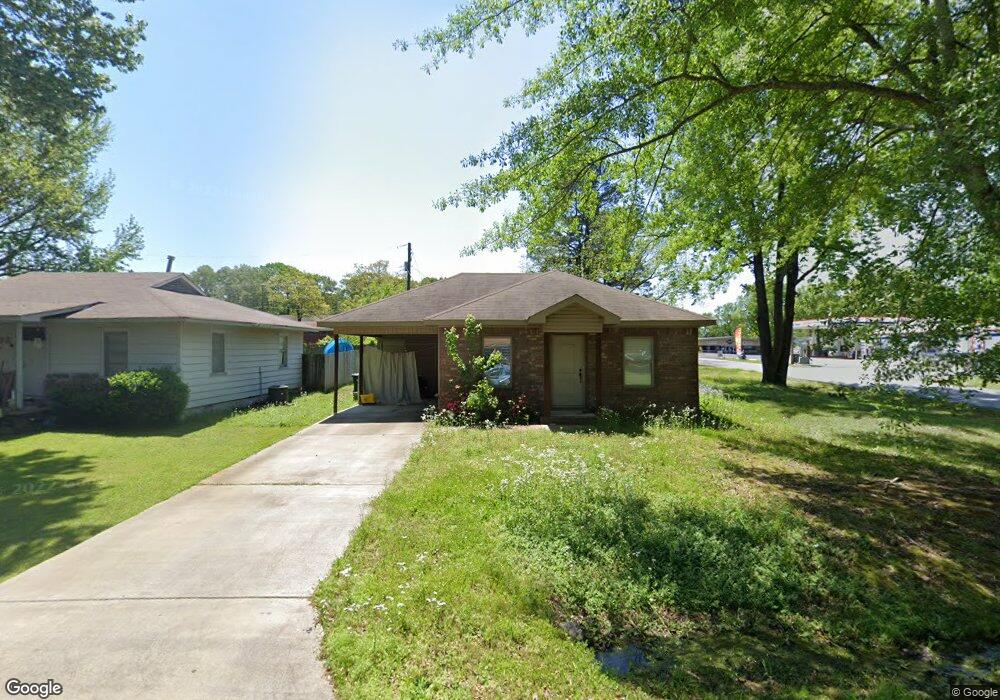
100 Ann Ave Sherwood, AR 72120
Estimated Value: $148,196 - $176,000
--
Bed
2
Baths
1,075
Sq Ft
$151/Sq Ft
Est. Value
About This Home
This home is located at 100 Ann Ave, Sherwood, AR 72120 and is currently estimated at $162,799, approximately $151 per square foot. 100 Ann Ave is a home located in Pulaski County with nearby schools including Oakbrooke Elementary School, Sylvan Hills Middle School, and Sylvan Hills High School.
Ownership History
Date
Name
Owned For
Owner Type
Purchase Details
Closed on
Feb 4, 2021
Sold by
Poyner Daniel S and Poyner Monica S
Bought by
Cozy House Rentals Llc
Current Estimated Value
Purchase Details
Closed on
Jun 11, 2015
Sold by
Wilson Myra
Bought by
Poyner Daniel S and Poyner Monica S
Purchase Details
Closed on
Dec 5, 2014
Sold by
Hsbc Bank Usa National Association
Bought by
Wilson Myra
Purchase Details
Closed on
Aug 1, 2014
Sold by
Hjelmstad Kirk A and Case #60-Cv-2012-744
Bought by
Hsbc Bank Usa National Association
Purchase Details
Closed on
Feb 5, 1999
Sold by
Youngblood Sharon L
Bought by
Hjelmstad Kirk A
Home Financials for this Owner
Home Financials are based on the most recent Mortgage that was taken out on this home.
Original Mortgage
$49,500
Interest Rate
6.79%
Mortgage Type
Purchase Money Mortgage
Create a Home Valuation Report for This Property
The Home Valuation Report is an in-depth analysis detailing your home's value as well as a comparison with similar homes in the area
Home Values in the Area
Average Home Value in this Area
Purchase History
| Date | Buyer | Sale Price | Title Company |
|---|---|---|---|
| Cozy House Rentals Llc | -- | None Listed On Document | |
| Poyner Daniel S | $16,000 | Standard Abstract & Title Co | |
| Wilson Myra | -- | None Available | |
| Hsbc Bank Usa National Association | $42,019 | None Available | |
| Hjelmstad Kirk A | $55,000 | American Abstract & Title Co |
Source: Public Records
Mortgage History
| Date | Status | Borrower | Loan Amount |
|---|---|---|---|
| Previous Owner | Hjelmstad Kirk A | $49,500 |
Source: Public Records
Tax History Compared to Growth
Tax History
| Year | Tax Paid | Tax Assessment Tax Assessment Total Assessment is a certain percentage of the fair market value that is determined by local assessors to be the total taxable value of land and additions on the property. | Land | Improvement |
|---|---|---|---|---|
| 2025 | $1,398 | $26,833 | $3,000 | $23,833 |
| 2024 | $1,398 | $26,833 | $3,000 | $23,833 |
| 2023 | $1,398 | $26,833 | $3,000 | $23,833 |
| 2022 | $1,551 | $26,833 | $3,000 | $23,833 |
| 2021 | $1,138 | $19,770 | $3,000 | $16,770 |
| 2020 | $1,132 | $19,770 | $3,000 | $16,770 |
| 2019 | $1,132 | $19,770 | $3,000 | $16,770 |
| 2018 | $1,132 | $19,770 | $3,000 | $16,770 |
| 2017 | $1,104 | $19,770 | $3,000 | $16,770 |
| 2016 | $167 | $3,200 | $3,200 | $0 |
| 2015 | $163 | $3,200 | $3,200 | $0 |
| 2014 | $163 | $14,070 | $3,200 | $10,870 |
Source: Public Records
Map
Nearby Homes
- 110 Ann Ave
- 208 Ann Ave
- 208 Calloway Ave
- 300 Calloway Ave
- 114 May St
- 5908 Glenhaven Place
- Lot 2 Witts Dr
- Lot 1 Witts Dr
- 8604 Northgate Dr
- 309 May St
- 401 Calloway Ave
- 404 May St
- 400 Cherrie Ave
- 3600 E Kiehl Ave
- 121 Bob o Link Ln
- 3116 Maxine Ave
- 604 Grandview St
- 110 Bob o Link Ln
- 608 Hemphill Rd
- 1 Shelby Rd