Estimated Value: $426,678 - $491,000
3
Beds
2
Baths
2,251
Sq Ft
$201/Sq Ft
Est. Value
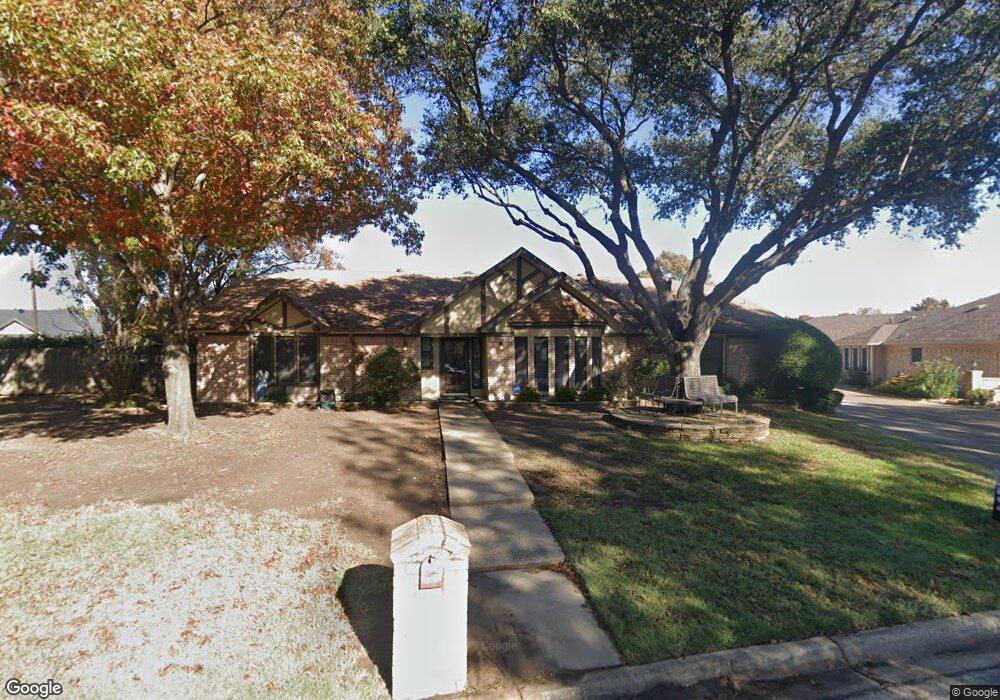
About This Home
This home is located at 100 Baker Ct, Hurst, TX 76054 and is currently estimated at $451,920, approximately $200 per square foot. 100 Baker Ct is a home located in Tarrant County with nearby schools including Shady Oaks Elementary School, Bedford Junior High School, and L.D. Bell High School.
Ownership History
Date
Name
Owned For
Owner Type
Purchase Details
Closed on
May 9, 2024
Sold by
Cook Dena and Hill Tobin
Bought by
Hill Tobin and Hill Dena
Current Estimated Value
Home Financials for this Owner
Home Financials are based on the most recent Mortgage that was taken out on this home.
Original Mortgage
$188,000
Outstanding Balance
$181,840
Interest Rate
6.82%
Mortgage Type
Credit Line Revolving
Estimated Equity
$270,080
Purchase Details
Closed on
Oct 21, 2004
Sold by
Smith Donald L and Smith Connie L
Bought by
Hill Tobin and Cook Dena
Home Financials for this Owner
Home Financials are based on the most recent Mortgage that was taken out on this home.
Original Mortgage
$146,000
Interest Rate
5.82%
Mortgage Type
Purchase Money Mortgage
Create a Home Valuation Report for This Property
The Home Valuation Report is an in-depth analysis detailing your home's value as well as a comparison with similar homes in the area
Home Values in the Area
Average Home Value in this Area
Purchase History
| Date | Buyer | Sale Price | Title Company |
|---|---|---|---|
| Hill Tobin | -- | Mortgage Connect | |
| Hill Tobin | -- | Rattikin Title Co |
Source: Public Records
Mortgage History
| Date | Status | Borrower | Loan Amount |
|---|---|---|---|
| Open | Hill Tobin | $188,000 | |
| Previous Owner | Hill Tobin | $146,000 |
Source: Public Records
Tax History
| Year | Tax Paid | Tax Assessment Tax Assessment Total Assessment is a certain percentage of the fair market value that is determined by local assessors to be the total taxable value of land and additions on the property. | Land | Improvement |
|---|---|---|---|---|
| 2025 | $5,810 | $369,318 | $80,000 | $289,318 |
| 2024 | $5,810 | $369,318 | $80,000 | $289,318 |
| 2023 | $6,986 | $386,083 | $55,000 | $331,083 |
| 2022 | $7,299 | $317,021 | $55,000 | $262,021 |
| 2021 | $7,000 | $290,255 | $55,000 | $235,255 |
| 2020 | $6,548 | $272,751 | $55,000 | $217,751 |
| 2019 | $6,056 | $280,746 | $55,000 | $225,746 |
| 2018 | $4,863 | $224,939 | $55,000 | $169,939 |
| 2017 | $5,175 | $227,428 | $40,000 | $187,428 |
| 2016 | $4,704 | $194,944 | $40,000 | $154,944 |
| 2015 | $3,952 | $169,000 | $17,000 | $152,000 |
| 2014 | $3,952 | $169,000 | $17,000 | $152,000 |
Source: Public Records
Map
Nearby Homes
- 201 W Louella Dr
- 201 Hillview Dr
- 137 E Louella Dr
- 412 Elisha Dr
- 1720 Acorn Ln
- 440 W Louella Dr
- 1740 Cynthia Ln
- 1761 Cynthia Ln
- 413 Baker Dr
- 1756 Cynthia Ln
- 1740 Brown Trail
- 180 Oakhurst Dr
- 2400 Summit View Dr
- 404 Mountainview Dr
- 1352 Simpson Dr
- 817 Shady Lake Dr
- 1348 Norwood Dr
- 3006 Carolyn Ct
- 421 Cavender Ct
- 600 Circleview Dr N
- 104 Baker Ct
- 101 Baker Ct
- 105 Baker Ct
- 200 Baker Dr
- 205 W Louella Dr
- 201 Baker Dr
- 204 Baker Dr
- 104 Circleview Dr N
- 100 Circleview Dr N
- 200 W Louella Dr
- 209 W Louella Dr
- 204 W Louella Dr
- 205 Baker Dr
- 200 Circleview Dr N
- 208 Baker Dr
- 208 W Louella Dr
- 1721 Louella Ct
- 213 W Louella Dr
- 1725 Louella Ct
- 1717 Louella Ct
Your Personal Tour Guide
Ask me questions while you tour the home.