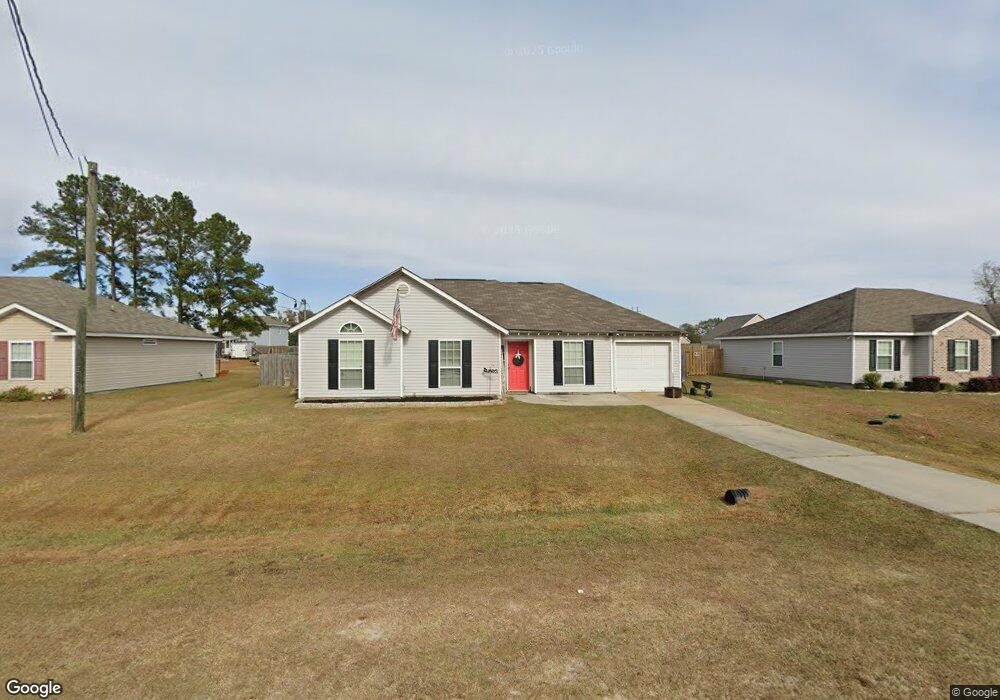
100 Bonnie Cir Ellabell, GA 31308
Estimated Value: $264,937 - $283,000
3
Beds
2
Baths
1,258
Sq Ft
$217/Sq Ft
Est. Value
About This Home
This home is located at 100 Bonnie Cir, Ellabell, GA 31308 and is currently estimated at $272,734, approximately $216 per square foot. 100 Bonnie Cir is a home located in Bryan County with nearby schools including Lanier Primary School, Bryan County Elementary School, and Bryan County Middle School.
Ownership History
Date
Name
Owned For
Owner Type
Purchase Details
Closed on
Oct 30, 2009
Sold by
Synergy Designer Homes Inc
Bought by
Ruarks Jason L
Current Estimated Value
Home Financials for this Owner
Home Financials are based on the most recent Mortgage that was taken out on this home.
Original Mortgage
$122,346
Outstanding Balance
$79,601
Interest Rate
4.93%
Mortgage Type
New Conventional
Estimated Equity
$193,133
Purchase Details
Closed on
Sep 16, 2009
Sold by
English Development Group Llc
Bought by
Synergy Designer Homes Inc
Home Financials for this Owner
Home Financials are based on the most recent Mortgage that was taken out on this home.
Original Mortgage
$122,346
Outstanding Balance
$79,601
Interest Rate
4.93%
Mortgage Type
New Conventional
Estimated Equity
$193,133
Purchase Details
Closed on
Aug 8, 2006
Bought by
English Development Group Llc
Create a Home Valuation Report for This Property
The Home Valuation Report is an in-depth analysis detailing your home's value as well as a comparison with similar homes in the area
Home Values in the Area
Average Home Value in this Area
Purchase History
| Date | Buyer | Sale Price | Title Company |
|---|---|---|---|
| Ruarks Jason L | $119,900 | -- | |
| Synergy Designer Homes Inc | $32,000 | -- | |
| English Development Group Llc | $20,000 | -- |
Source: Public Records
Mortgage History
| Date | Status | Borrower | Loan Amount |
|---|---|---|---|
| Open | Ruarks Jason L | $122,346 |
Source: Public Records
Tax History Compared to Growth
Tax History
| Year | Tax Paid | Tax Assessment Tax Assessment Total Assessment is a certain percentage of the fair market value that is determined by local assessors to be the total taxable value of land and additions on the property. | Land | Improvement |
|---|---|---|---|---|
| 2024 | $2,330 | $81,760 | $14,000 | $67,760 |
| 2023 | $2,281 | $66,880 | $14,000 | $52,880 |
| 2022 | $1,823 | $59,400 | $21,000 | $38,400 |
| 2021 | $1,652 | $50,960 | $14,000 | $36,960 |
| 2020 | $1,144 | $45,960 | $9,000 | $36,960 |
| 2019 | $1,541 | $45,400 | $9,000 | $36,400 |
| 2018 | $1,438 | $43,600 | $7,200 | $36,400 |
| 2017 | $1,287 | $40,520 | $6,000 | $34,520 |
| 2016 | $1,273 | $39,480 | $6,000 | $33,480 |
| 2015 | $1,309 | $40,800 | $8,000 | $32,800 |
| 2014 | $1,328 | $41,480 | $8,000 | $33,480 |
Source: Public Records
Map
Nearby Homes
- 35 Oscar Ct
- 120 Bonnie Cir
- 35 Bonnie Cir
- 310 Bonnie Cir
- 285 Creekside Cir
- 105 Creekside Cir
- 210 Zachary Trail
- 628 Toni Branch Rd
- 190 Freeman Dr
- 8 Palmetto Dr
- 335 Joshua Cir
- 0 Ga 204 Hwy Unit 328802
- 410 Joshua Cir
- 725 Blue Gill Rd
- 397 Pine Ridge Dr
- 50 & 100 Hallelujah Trail
- 100 Hallelujah Trail
- 58 Pine Ridge Ct
- 89 Wade Carter Rd
- 479 Mannie English Rd
- 110 Bonnie Cir
- 90 Bonnie Cir
- 25 Oscar Ct Unit 49
- 25 Oscar Ct
- 0 Bonnie Cir Unit 7001088
- 0 Bonnie Cir Unit 8860902
- 0 Bonnie Cir Unit 8649495
- 0 Bonnie Cir Unit 8615791
- 0 Bonnie Cir Unit 8514273
- 0 Bonnie Cir
- 25 Alvidine Ln
- 45 Oscar Ct
- 70 Bonnie Cir
- 115 Bonnie Cir
- 105 Bonnie Cir
- 125 Bonnie Cir
- 130 Bonnie Cir
- 140 Bonnie Cir
- 95 Bonnie Cir
- 35 Alvidine Ln