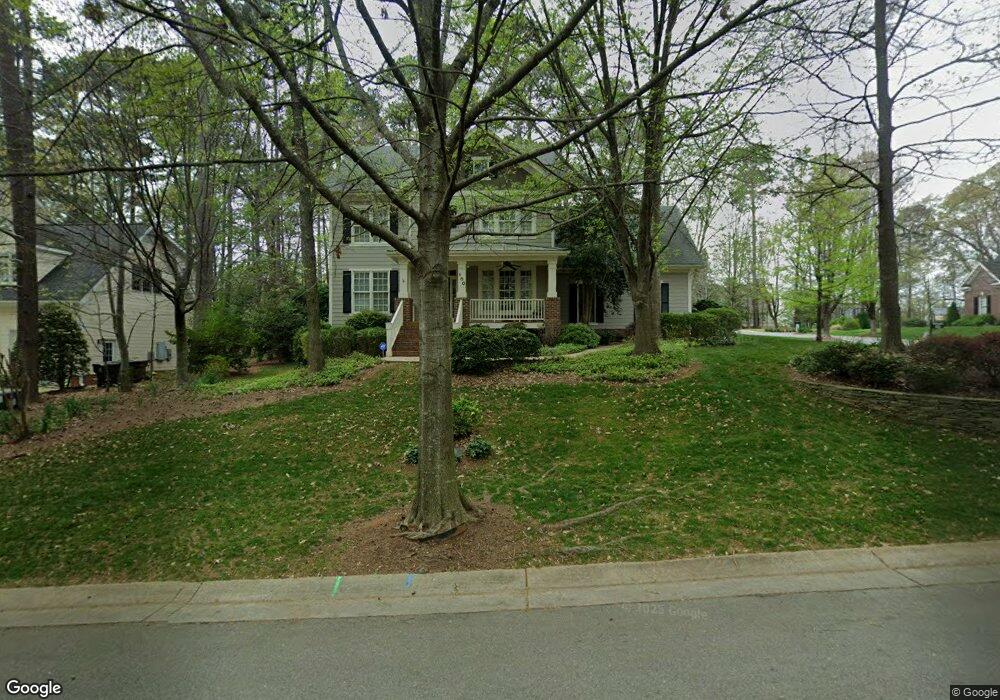
100 Branchside Ln Holly Springs, NC 27540
Estimated Value: $698,000 - $776,000
4
Beds
3
Baths
2,836
Sq Ft
$260/Sq Ft
Est. Value
About This Home
This home is located at 100 Branchside Ln, Holly Springs, NC 27540 and is currently estimated at $737,147, approximately $259 per square foot. 100 Branchside Ln is a home located in Wake County with nearby schools including Holly Springs Elementary School, Holly Ridge Middle School, and Holly Springs High School.
Ownership History
Date
Name
Owned For
Owner Type
Purchase Details
Closed on
May 8, 2019
Sold by
Dixon Marvin Lee and Dixon Virginia E
Bought by
Griswold Paul and Mccarrell Gregg
Current Estimated Value
Home Financials for this Owner
Home Financials are based on the most recent Mortgage that was taken out on this home.
Original Mortgage
$219,000
Outstanding Balance
$192,154
Interest Rate
4.1%
Mortgage Type
New Conventional
Estimated Equity
$544,993
Purchase Details
Closed on
Feb 15, 2007
Sold by
Cerniway Matthew and Cerniway Rachael
Bought by
Dixon Marvin Lee and Dixon Virginia E
Home Financials for this Owner
Home Financials are based on the most recent Mortgage that was taken out on this home.
Original Mortgage
$154,900
Interest Rate
6.08%
Mortgage Type
Purchase Money Mortgage
Purchase Details
Closed on
Oct 20, 2004
Sold by
Whg Inc
Bought by
Cerniway Matthew and Cerniway Rachael
Home Financials for this Owner
Home Financials are based on the most recent Mortgage that was taken out on this home.
Original Mortgage
$284,374
Interest Rate
5.64%
Mortgage Type
Purchase Money Mortgage
Create a Home Valuation Report for This Property
The Home Valuation Report is an in-depth analysis detailing your home's value as well as a comparison with similar homes in the area
Home Values in the Area
Average Home Value in this Area
Purchase History
| Date | Buyer | Sale Price | Title Company |
|---|---|---|---|
| Griswold Paul | $444,000 | None Available | |
| Dixon Marvin Lee | $430,000 | None Available | |
| Cerniway Matthew | $356,500 | -- |
Source: Public Records
Mortgage History
| Date | Status | Borrower | Loan Amount |
|---|---|---|---|
| Open | Griswold Paul | $219,000 | |
| Previous Owner | Dixon Marvin Lee | $154,900 | |
| Previous Owner | Cerniway Matthew | $284,374 |
Source: Public Records
Tax History Compared to Growth
Tax History
| Year | Tax Paid | Tax Assessment Tax Assessment Total Assessment is a certain percentage of the fair market value that is determined by local assessors to be the total taxable value of land and additions on the property. | Land | Improvement |
|---|---|---|---|---|
| 2025 | $5,744 | $665,174 | $150,000 | $515,174 |
| 2024 | $5,721 | $665,174 | $150,000 | $515,174 |
| 2023 | $4,895 | $451,953 | $80,000 | $371,953 |
| 2022 | $4,725 | $451,953 | $80,000 | $371,953 |
| 2021 | $4,637 | $451,953 | $80,000 | $371,953 |
| 2020 | $4,637 | $451,953 | $80,000 | $371,953 |
| 2019 | $4,803 | $397,510 | $75,000 | $322,510 |
| 2018 | $4,341 | $397,510 | $75,000 | $322,510 |
| 2017 | $4,184 | $397,510 | $75,000 | $322,510 |
| 2016 | $4,126 | $397,510 | $75,000 | $322,510 |
| 2015 | $4,459 | $422,916 | $85,000 | $337,916 |
| 2014 | $4,304 | $422,916 | $85,000 | $337,916 |
Source: Public Records
Map
Nearby Homes
- 204 Chrismill Ln
- 208 Apple Drupe Way
- 112 Midden Way
- 228 Masden Rd
- 0 Old Ride Dr
- 116 Cobblebrook Ct
- 401 Wellspring Dr
- 225 Old Ride Dr
- 305 Wellspring Dr
- 208 Old Ride Dr
- 112 Sanchez Ct
- 217 Jones Hill Rd
- 413 Rhamkatte Rd
- 138 Cobalt Creek Way
- 108 Warm Wood Ln
- 329 N Main St
- 129 Starwood Ln
- 109 Willow View Ln
- 204 Crossway Ln
- 213 Capello Ct
- 304 Creekvista Dr
- 300 Creekvista Dr
- 101 Branchside Ln
- 349 Chrismill Ln
- 105 Branchside Ln
- 345 Chrismill Ln
- 401 Chrismill Ln
- 208 Creekvista Dr
- 112 Branchside Ln
- 341 Chrismill Ln
- 100 Cliffcreek Dr
- 405 Chrismill Ln
- 337 Chrismill Ln
- 209 Creekvista Dr
- 1009 Crossway Ln
- 204 Creekvista Dr
- 1005 Crossway Ln
- 104 Cliffcreek Dr
- 409 Chrismill Ln
- 200 Branchside Ln