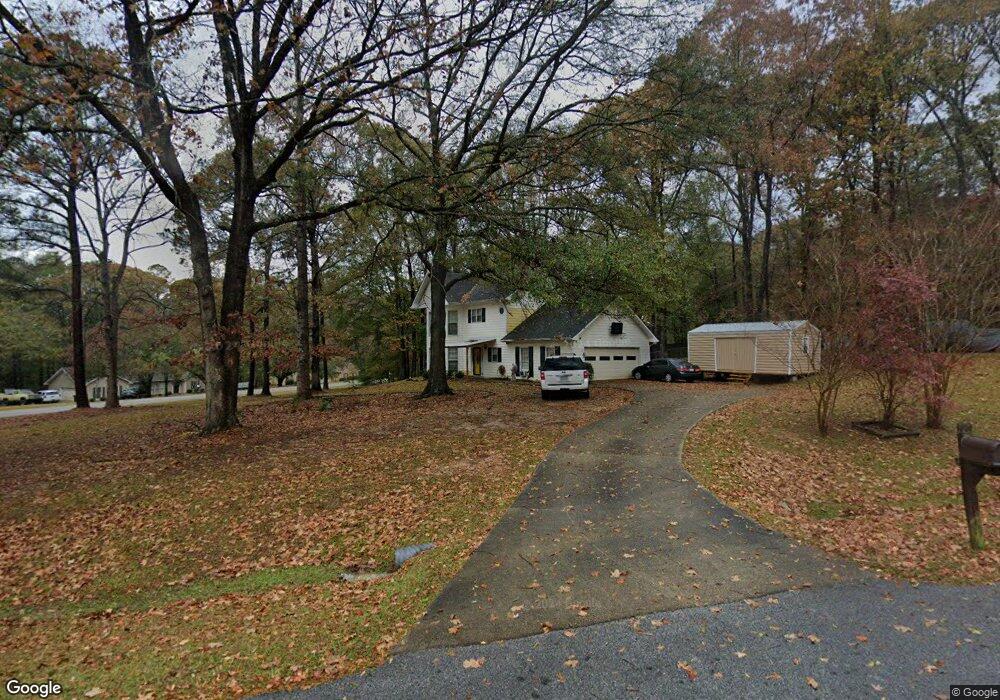
100 Briar Ct Lagrange, GA 30241
Estimated Value: $257,000 - $270,000
3
Beds
3
Baths
1,624
Sq Ft
$163/Sq Ft
Est. Value
About This Home
This home is located at 100 Briar Ct, Lagrange, GA 30241 and is currently estimated at $263,933, approximately $162 per square foot. 100 Briar Ct is a home located in Troup County with nearby schools including Callaway Elementary School, Hogansville Elementary School, and Callaway Middle School.
Ownership History
Date
Name
Owned For
Owner Type
Purchase Details
Closed on
Jun 14, 2007
Sold by
Nelson Peter M
Bought by
Hodge Michael
Current Estimated Value
Home Financials for this Owner
Home Financials are based on the most recent Mortgage that was taken out on this home.
Original Mortgage
$136,400
Outstanding Balance
$81,698
Interest Rate
6.16%
Mortgage Type
New Conventional
Estimated Equity
$182,235
Purchase Details
Closed on
Jun 1, 2001
Sold by
Hill George D and Hill Jackie L
Bought by
Peter M Nelson
Purchase Details
Closed on
Aug 7, 1995
Sold by
Graham Tucker H
Bought by
Hill George D and Hill Jackie L
Purchase Details
Closed on
Sep 29, 1989
Bought by
Graham Tucker H
Purchase Details
Closed on
Sep 20, 1989
Purchase Details
Closed on
Jan 1, 1989
Purchase Details
Closed on
Feb 1, 1987
Create a Home Valuation Report for This Property
The Home Valuation Report is an in-depth analysis detailing your home's value as well as a comparison with similar homes in the area
Purchase History
| Date | Buyer | Sale Price | Title Company |
|---|---|---|---|
| Hodge Michael | $136,400 | -- | |
| Peter M Nelson | $120,000 | -- | |
| Hill George D | $91,000 | -- | |
| Graham Tucker H | -- | -- | |
| -- | -- | -- | |
| -- | $83,800 | -- | |
| -- | $83,800 | -- | |
| -- | -- | -- |
Source: Public Records
Mortgage History
| Date | Status | Borrower | Loan Amount |
|---|---|---|---|
| Open | Hodge Michael | $136,400 |
Source: Public Records
Tax History
| Year | Tax Paid | Tax Assessment Tax Assessment Total Assessment is a certain percentage of the fair market value that is determined by local assessors to be the total taxable value of land and additions on the property. | Land | Improvement |
|---|---|---|---|---|
| 2025 | $2,293 | $88,416 | $14,000 | $74,416 |
| 2024 | $2,176 | $81,760 | $14,000 | $67,760 |
| 2023 | $2,261 | $84,896 | $14,000 | $70,896 |
| 2022 | $1,890 | $69,696 | $10,000 | $59,696 |
| 2021 | $1,734 | $59,468 | $10,000 | $49,468 |
| 2020 | $1,605 | $59,468 | $10,000 | $49,468 |
| 2019 | $1,427 | $49,316 | $6,000 | $43,316 |
| 2018 | $1,362 | $47,152 | $6,000 | $41,152 |
| 2017 | $1,362 | $47,152 | $6,000 | $41,152 |
| 2016 | $1,337 | $46,328 | $6,000 | $40,328 |
| 2015 | $1,282 | $44,398 | $4,500 | $39,898 |
| 2014 | $1,220 | $42,298 | $4,500 | $37,798 |
| 2013 | -- | $44,555 | $4,500 | $40,055 |
Source: Public Records
Map
Nearby Homes
- 2477 Upper Big Springs Rd
- 123 Wexford Dr
- 56 John Lovelace Rd
- 86 John Lovelace Rd
- 810 Callaway Church Rd
- 830 John Lovelace Rd
- 950 John Lovelace Rd
- 91 Almond Rd
- 111 Revere Ct
- 109 Nashua Dr
- 208 N Davis Rd
- 311 Mourning Ct Unit LOT 33
- 107 Beaver Creek Way Unit 249
- 107 Beaver Creek Way
- 103 Beaver Creek Way
- 103 Beaver Creek Way Unit 247
- 101 Beaver Creek Way
- 101 Beaver Creek Way Unit 246
- 100 Dove Creek Ct
- 104 Beaver Creek Way
- 116 Greenbriar Trail Unit 64
- 116 Greenbriar Trail
- 102 Briar Ct
- 120 Greenbriar Trail
- 129 Greenbriar Trail
- 114 Greenbriar Trail
- 131 Greenbriar Trail
- 108 Briar Ct
- 133 Greenbriar Trail
- 127 Greenbriar Trail
- 122 Greenbriar Trail
- 104 Briar Ct
- 106 Briar Ct Unit 60
- 106 Briar Ct
- 135 Greenbriar Trail
- 125 Greenbriar Trail
- 112 Greenbriar Trail
- 137 Greenbriar Trail
- 124 Greenbriar Trail
- 108 Greenbriar Trail
Your Personal Tour Guide
Ask me questions while you tour the home.