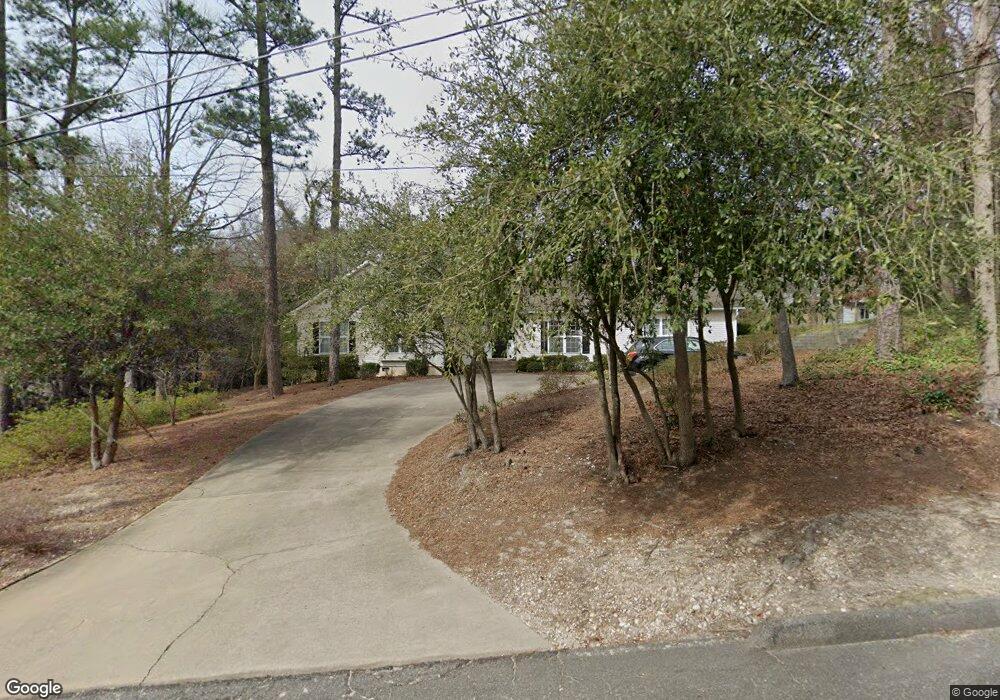
100 Brooklyn St Carthage, NC 28327
Estimated Value: $377,000 - $416,000
4
Beds
3
Baths
2,598
Sq Ft
$153/Sq Ft
Est. Value
About This Home
This home is located at 100 Brooklyn St, Carthage, NC 28327 and is currently estimated at $398,099, approximately $153 per square foot. 100 Brooklyn St is a home located in Moore County with nearby schools including Carthage Elementary School, New Century Middle School, and Union Pines High School.
Create a Home Valuation Report for This Property
The Home Valuation Report is an in-depth analysis detailing your home's value as well as a comparison with similar homes in the area
Home Values in the Area
Average Home Value in this Area
Tax History
| Year | Tax Paid | Tax Assessment Tax Assessment Total Assessment is a certain percentage of the fair market value that is determined by local assessors to be the total taxable value of land and additions on the property. | Land | Improvement |
|---|---|---|---|---|
| 2024 | $2,454 | $287,870 | $23,610 | $264,260 |
| 2023 | $2,512 | $287,870 | $23,610 | $264,260 |
| 2022 | $2,107 | $204,530 | $10,110 | $194,420 |
| 2021 | $2,158 | $204,530 | $10,110 | $194,420 |
| 2020 | $2,179 | $204,530 | $10,110 | $194,420 |
| 2019 | $2,179 | $204,530 | $10,110 | $194,420 |
| 2018 | $1,976 | $197,550 | $10,110 | $187,440 |
| 2017 | $1,956 | $197,550 | $10,110 | $187,440 |
| 2015 | $1,936 | $197,550 | $10,110 | $187,440 |
| 2014 | $1,715 | $187,450 | $20,440 | $167,010 |
| 2013 | -- | $187,450 | $20,440 | $167,010 |
Source: Public Records
Map
Nearby Homes
- 716 Pinecrest St
- 303 Mcreynolds St
- 309 Buggy Dr W
- 308 Buggy Dr W
- 122 Ross Rd
- Lot 50/51, Dowd Rd
- 000 Us 15-501 Hwy
- 2592 Old Glendon Rd
- 0 Saint Augustine Church Rd
- 201 Poplar St
- 410 Paradise Ln
- 906 Sunset Dr
- 912 Sunset Dr
- 806 Currie St
- 00 Isley St
- TBD Currie St
- 801 Monroe St
- 207 Bingham St
- 125 Carver St
- 131 Carver St
- 106 Brooklyn St
- 701 Mcreynolds St
- 103 Brooklyn St
- 703 Mcreynolds St
- 611 Mcreynolds St
- 705 Mcreynolds St Unit C
- 705 Mcreynolds St Unit E
- 705 Mcreynolds St
- 704 Mcreynolds St
- 105 Brooklyn St
- 110 Brooklyn St
- 710 Mcreynolds St
- 609 Mcreynolds St
- 610 Mcreynolds St
- 608 Mcreynolds St
- 607 Mcreynolds St
- 107 Brooklyn St
- 112 Brooklyn St
- 702 Pinecrest St
- 605 Mcreynolds St
Your Personal Tour Guide
Ask me questions while you tour the home.