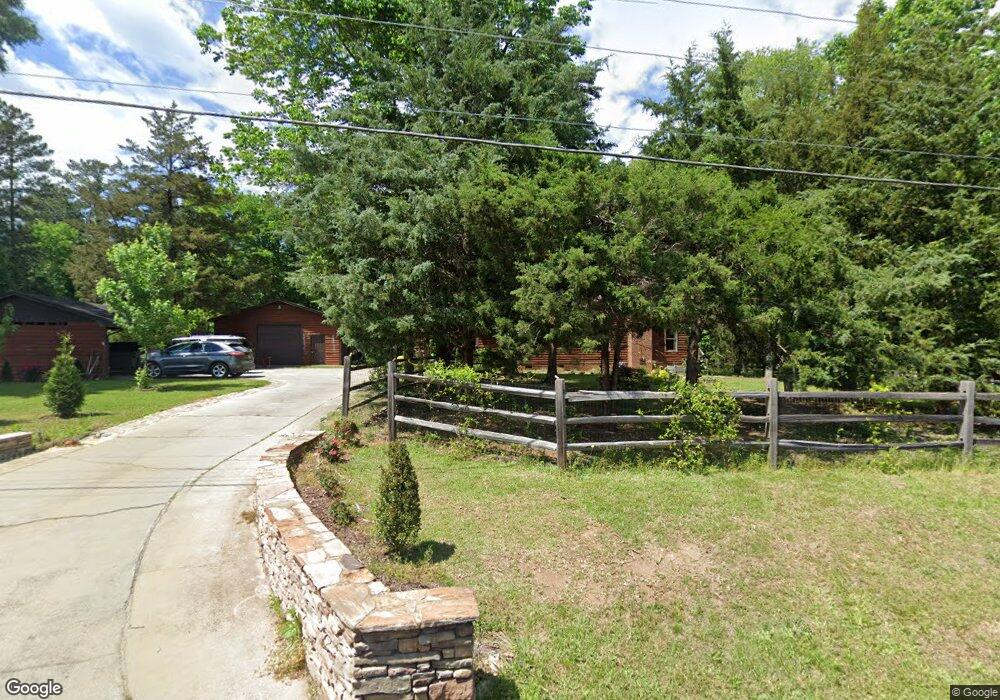
100 Captain Lowman Rd Chapin, SC 29036
Estimated Value: $567,000 - $632,000
4
Beds
4
Baths
3,528
Sq Ft
$169/Sq Ft
Est. Value
About This Home
This home is located at 100 Captain Lowman Rd, Chapin, SC 29036 and is currently estimated at $594,541, approximately $168 per square foot. 100 Captain Lowman Rd is a home located in Richland County with nearby schools including Lake Murray Elementary School, Chapin Intermediate, and Chapin High School.
Ownership History
Date
Name
Owned For
Owner Type
Purchase Details
Closed on
Apr 18, 2013
Sold by
Huff Gilda
Bought by
Stier Patrick N
Current Estimated Value
Home Financials for this Owner
Home Financials are based on the most recent Mortgage that was taken out on this home.
Original Mortgage
$218,500
Outstanding Balance
$155,067
Interest Rate
3.59%
Mortgage Type
New Conventional
Estimated Equity
$439,474
Purchase Details
Closed on
Feb 22, 2008
Sold by
Cajigas Gilda
Bought by
Huff Gilda
Home Financials for this Owner
Home Financials are based on the most recent Mortgage that was taken out on this home.
Original Mortgage
$400,000
Interest Rate
5.65%
Mortgage Type
Construction
Purchase Details
Closed on
Apr 12, 2004
Sold by
Odom Paul E and Odom Linda E
Bought by
Cajigas Gilda
Home Financials for this Owner
Home Financials are based on the most recent Mortgage that was taken out on this home.
Original Mortgage
$155,000
Interest Rate
5.38%
Mortgage Type
Purchase Money Mortgage
Create a Home Valuation Report for This Property
The Home Valuation Report is an in-depth analysis detailing your home's value as well as a comparison with similar homes in the area
Home Values in the Area
Average Home Value in this Area
Purchase History
| Date | Buyer | Sale Price | Title Company |
|---|---|---|---|
| Stier Patrick N | $276,000 | None Available | |
| Huff Gilda | -- | -- | |
| Cajigas Gilda | $185,000 | -- |
Source: Public Records
Mortgage History
| Date | Status | Borrower | Loan Amount |
|---|---|---|---|
| Open | Stier Patrick N | $218,500 | |
| Previous Owner | Huff Gilda | $400,000 | |
| Previous Owner | Cajigas Gilda | $155,000 |
Source: Public Records
Tax History Compared to Growth
Tax History
| Year | Tax Paid | Tax Assessment Tax Assessment Total Assessment is a certain percentage of the fair market value that is determined by local assessors to be the total taxable value of land and additions on the property. | Land | Improvement |
|---|---|---|---|---|
| 2024 | $2,915 | $351,100 | $0 | $0 |
| 2023 | $2,802 | $12,212 | $0 | $0 |
| 2022 | $2,425 | $305,300 | $48,400 | $256,900 |
| 2021 | $2,459 | $12,210 | $0 | $0 |
| 2020 | $2,576 | $12,210 | $0 | $0 |
| 2019 | $2,568 | $12,210 | $0 | $0 |
| 2018 | $2,142 | $11,380 | $0 | $0 |
| 2017 | $2,084 | $11,380 | $0 | $0 |
| 2016 | $2,074 | $11,380 | $0 | $0 |
| 2015 | $2,085 | $11,380 | $0 | $0 |
| 2014 | $2,080 | $284,600 | $0 | $0 |
| 2013 | -- | $11,200 | $0 | $0 |
Source: Public Records
Map
Nearby Homes
- 177 Lakeport Dr
- 0 Johnson Marina Rd Unit 539063
- 312 Lanyard Ln
- 756 Helmsman Ln
- 608 Calypso Ct
- 1304 Silver Point Rd
- 613 Calypso Ct
- 739 Helmsman Ln
- 149 Lakeport Dr
- 123 Jasmine Bay Ln
- 313 Explorer Dr
- 371 Explorer Dr
- 740 Ruskin Dr
- 550 Malachite Ln
- 515 Malachite Ln
- 509 Malachite Ln
- 13 Botticelli Ct
- 175 Almofini Ln
- 818 Ruskin Dr
- 1318 Portrait Hill Dr
- 1600 Johnson Marina Rd
- 1601 Johnson Marina Rd
- 1609 Johnson Marina Rd
- 1540 Johnson Marina Rd
- 111 Captain Lowman Rd
- 115 Captain Lowman Rd
- 1701 Johnson Marina Rd
- 185 Lakeport Dr
- 1028 Silver Point Rd
- 189 Lakeport Dr
- 181 Lakeport Dr
- 536 Slices Way
- 535 Slices Way
- 1705 Johnson Marina Rd
- 532 Slice's Way
- 1032 Silver Point Rd
- 528 Slices Way
- 193 Lakeport Dr
- 527 Slices Way
- 173 Lakeport Dr