
Landlord's Agent in 2014
Brigittea Casey
Coldwell Banker Realty - Boston
(617) 596-1449
14 in this area
15 Total Sales
Estimated Value: $351,000 - $531,000
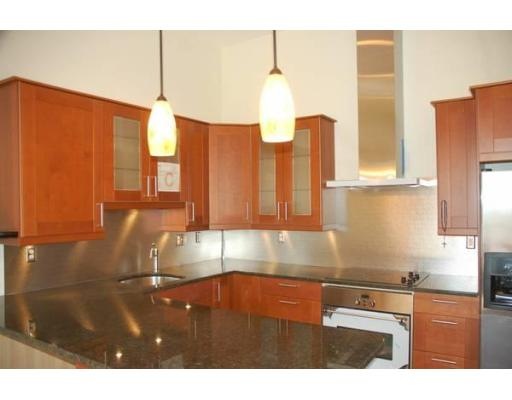
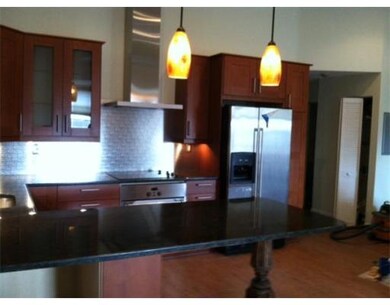
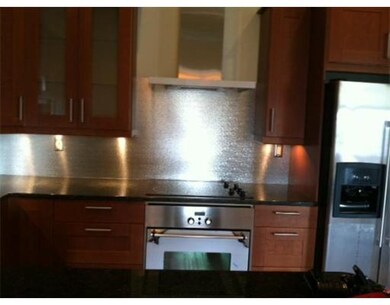
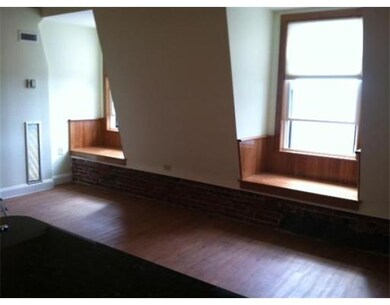
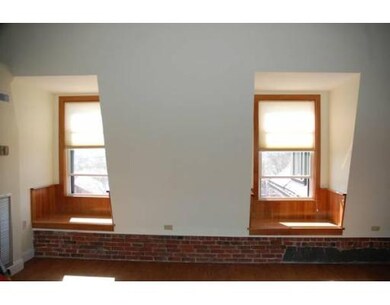
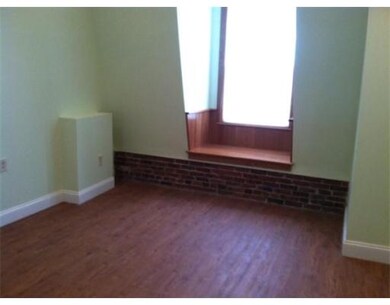
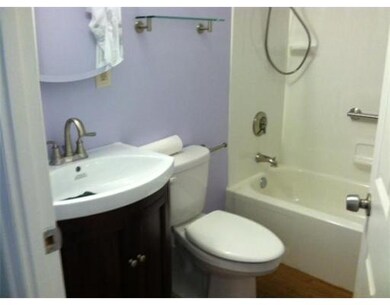
Admiral's Hill Historic Building - totally renovated top floor 1 bed penthouse with open floor plan and city skyline views. High end finishes throughout offering HWF, high ceilings, new windows, ceiling fans, open granite/SS kitchen with large counter and SS backsplash, new bath and good size bedroom. Lots of storage in unit with 2 very large closets plus extra storage in basement. 1 parking included. Central heat/AC. Tenant pays electric. Convenient to downtown Boston, Logan Airport and major highways. Walk to local waterfront park and enjoy walking paths, tennis courts and marina. Local restaurants and shopping nearby. On 112 bus line to Orange or Blue line and .30cents for Tobin Bridge for Chelsea residents.
Last Agent to Rent the Property
Coldwell Banker Realty - Boston Listed on: 04/15/2014
Home Type
Other
Est. Annual Taxes
$4,090
Year Built
1900
Lot Details
0
| Date | Buyer | Sale Price | Title Company |
|---|---|---|---|
| Tremont Cu | $108,000 | -- | |
| Tremont Cu | $108,000 | -- | |
| Green John R | $60,000 | -- | |
| Green John R | $60,000 | -- | |
| Quinn Kevin W | $112,500 | -- |
| Date | Status | Borrower | Loan Amount |
|---|---|---|---|
| Previous Owner | Quinn Kevin W | $116,000 | |
| Previous Owner | Quinn Kevin W | $82,000 | |
| Previous Owner | Quinn Kevin W | $60,000 |
| Date | Event | Price | List to Sale | Price per Sq Ft |
|---|---|---|---|---|
| 04/15/2014 04/15/14 | Rented | $1,595 | -5.9% | -- |
| 04/15/2014 04/15/14 | For Rent | $1,695 | -- | -- |
| Year | Tax Paid | Tax Assessment Tax Assessment Total Assessment is a certain percentage of the fair market value that is determined by local assessors to be the total taxable value of land and additions on the property. | Land | Improvement |
|---|---|---|---|---|
| 2025 | $4,090 | $355,300 | $0 | $355,300 |
| 2024 | $4,033 | $338,900 | $0 | $338,900 |
| 2023 | $3,934 | $317,800 | $0 | $317,800 |
| 2022 | $3,536 | $266,900 | $0 | $266,900 |
| 2021 | $3,731 | $273,900 | $0 | $273,900 |
| 2020 | $3,452 | $257,800 | $0 | $257,800 |
| 2019 | $3,436 | $241,100 | $0 | $241,100 |
| 2018 | $2,991 | $212,100 | $0 | $212,100 |
| 2017 | $2,478 | $172,800 | $0 | $172,800 |
| 2016 | $2,428 | $170,400 | $0 | $170,400 |
| 2015 | $2,321 | $161,200 | $0 | $161,200 |
| 2014 | $2,123 | $142,700 | $0 | $142,700 |
Landlord's Agent in 2014
Brigittea Casey
Coldwell Banker Realty - Boston
(617) 596-1449
14 in this area
15 Total Sales
Source: MLS Property Information Network (MLS PIN)
MLS Number: 71661197
APN: CHEL-000018-000000-000096AG
Disclaimer: Certain information contained herein is derived from information provided by parties other than Homes.com. All information provided is deemed reliable, but is not guaranteed to be accurate and should be independently verified.
![]() The property listing data and information, or the Images, set forth herein were provided to MLS Property Information Network, Inc. from third party sources, including sellers, lessors and public records, and were compiled by MLS Property Information Network, Inc. The property listing data and information, and the Images, are for the personal, non-commercial use of consumers having a good faith interest in purchasing or leasing listed properties of the type displayed to them and may not be used for any purpose other than to identify prospective properties which such consumers may have a good faith interest in purchasing or leasing. MLS Property Information Network, Inc. and its subscribers disclaim any and all representations and warranties as to the accuracy of the property listing data and information, or as to the accuracy of any of the Images, set forth herein.
The property listing data and information, or the Images, set forth herein were provided to MLS Property Information Network, Inc. from third party sources, including sellers, lessors and public records, and were compiled by MLS Property Information Network, Inc. The property listing data and information, and the Images, are for the personal, non-commercial use of consumers having a good faith interest in purchasing or leasing listed properties of the type displayed to them and may not be used for any purpose other than to identify prospective properties which such consumers may have a good faith interest in purchasing or leasing. MLS Property Information Network, Inc. and its subscribers disclaim any and all representations and warranties as to the accuracy of the property listing data and information, or as to the accuracy of any of the Images, set forth herein.