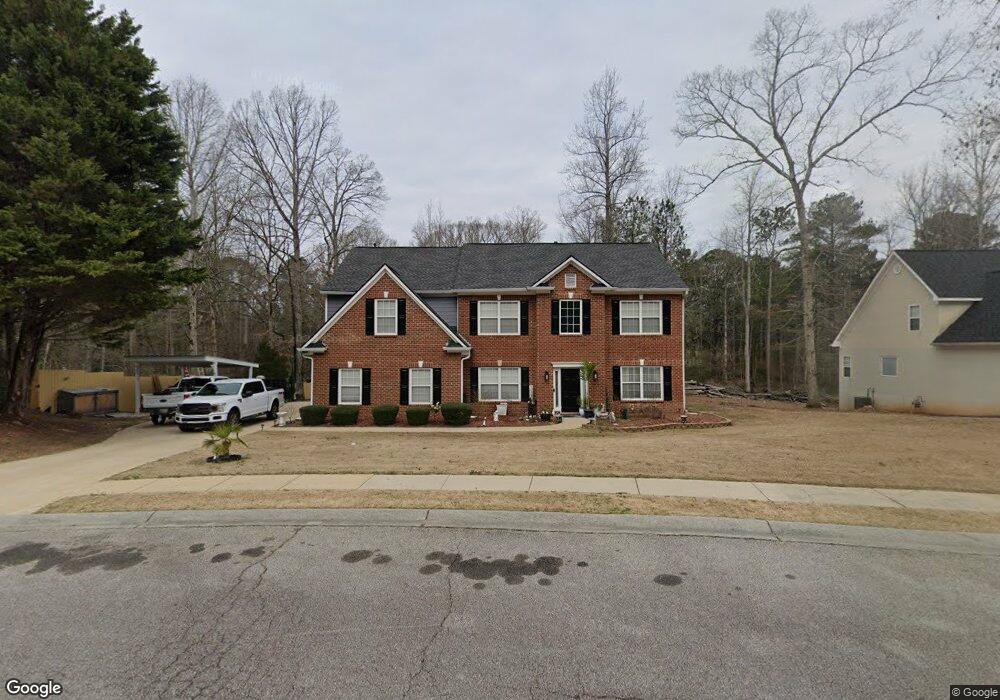
100 Chadwick Place Unit 27 Villa Rica, GA 30180
Estimated Value: $506,000 - $530,000
4
Beds
3
Baths
3,302
Sq Ft
$157/Sq Ft
Est. Value
About This Home
This home is located at 100 Chadwick Place Unit 27, Villa Rica, GA 30180 and is currently estimated at $518,727, approximately $157 per square foot. 100 Chadwick Place Unit 27 is a home located in Carroll County with nearby schools including Mirror Lake Elementary School, Mason Creek Middle School, and Douglas County High School.
Ownership History
Date
Name
Owned For
Owner Type
Purchase Details
Closed on
Aug 21, 2020
Sold by
Spitler Nathan Randall
Bought by
Alberto Salvador Antonio
Current Estimated Value
Purchase Details
Closed on
Feb 27, 2013
Sold by
Turner Bobby
Bought by
Spitler Nathan Randall
Purchase Details
Closed on
Oct 31, 2003
Sold by
Sharon Mcswain Homes Inc
Bought by
Turner Bobby and Turner Paula
Purchase Details
Closed on
Apr 18, 2003
Sold by
Branch Banking & Trust Co
Bought by
Sharon Mcswain Homes Inc
Purchase Details
Closed on
Feb 4, 2003
Sold by
Chadwick Place Llc
Bought by
Branch Banking & Trust Co
Purchase Details
Closed on
Jul 17, 2000
Sold by
Hunter International
Bought by
Chadwick Place Llc
Purchase Details
Closed on
Oct 29, 1999
Sold by
Medley Betty Jane
Bought by
Hunter International
Purchase Details
Closed on
Jan 27, 1990
Bought by
Medley Betty Jane
Create a Home Valuation Report for This Property
The Home Valuation Report is an in-depth analysis detailing your home's value as well as a comparison with similar homes in the area
Home Values in the Area
Average Home Value in this Area
Purchase History
| Date | Buyer | Sale Price | Title Company |
|---|---|---|---|
| Alberto Salvador Antonio | $259,500 | -- | |
| Spitler Nathan Randall | $120,000 | -- | |
| Turner Bobby | $189,600 | -- | |
| Sharon Mcswain Homes Inc | $935,000 | -- | |
| Branch Banking & Trust Co | -- | -- | |
| Chadwick Place Llc | $891,000 | -- | |
| Hunter International | $287,400 | -- | |
| Medley Betty Jane | -- | -- |
Source: Public Records
Tax History Compared to Growth
Tax History
| Year | Tax Paid | Tax Assessment Tax Assessment Total Assessment is a certain percentage of the fair market value that is determined by local assessors to be the total taxable value of land and additions on the property. | Land | Improvement |
|---|---|---|---|---|
| 2024 | $5,277 | $194,076 | $8,800 | $185,276 |
| 2023 | $5,277 | $177,228 | $8,800 | $168,428 |
| 2022 | $4,450 | $142,040 | $8,800 | $133,240 |
| 2021 | $3,310 | $122,664 | $8,800 | $113,864 |
| 2020 | $2,965 | $110,464 | $8,800 | $101,664 |
| 2019 | $2,675 | $100,181 | $8,800 | $91,381 |
| 2018 | $2,392 | $86,373 | $8,800 | $77,573 |
| 2017 | $2,296 | $81,173 | $4,000 | $77,173 |
| 2016 | $2,307 | $81,173 | $4,000 | $77,173 |
| 2015 | $1,625 | $50,385 | $8,000 | $42,385 |
| 2014 | $1,554 | $50,385 | $8,000 | $42,385 |
Source: Public Records
Map
Nearby Homes
- 511 Punkintown Rd
- 25 Stoneway Dr
- 130 Chadwick Place
- 162 Parkway Cir
- 9811 Spyglass Dr
- 9961 Harmon Springs Dr
- 2580 Three Wood Dr
- 2156 Raccoon Ct
- 2455 Ridgelake Dr
- 1030 Overlook Dr
- 224 Crest Creek Way
- 0 Mccurdy Rd Unit 10415773
- 2646 Neighborhood Walk S
- 9916 Stockmar Rd
- 2685 Mariner Way
- 2643 Neighborhood Walk S
- 0 Conners Rd Unit 10569546
- 9626 Coastal Pointe Dr
- 9620 Coastal Pointe Dr
- 100 Chadwick Place
- 106 Chadwick Place
- 109 Chadwick Place
- 112 Chadwick Place
- 484 Punkintown Rd
- 103 Chadwick Place
- 115 Chadwick Place
- 494 Punkintown Rd
- 468 Punkintown Rd
- 118 Chadwick Place
- 504 Punkintown Rd
- 121 Chadwick Place
- 458 Punkintown Rd
- 27 Parkway Cir Unit 31
- 27 Parkway Cir
- 124 Chadwick Place
- 0 Chadwick Place Unit 7509596
- 0 Chadwick Place Unit 8418768
- 0 Chadwick Place
- 127 Chadwick Place