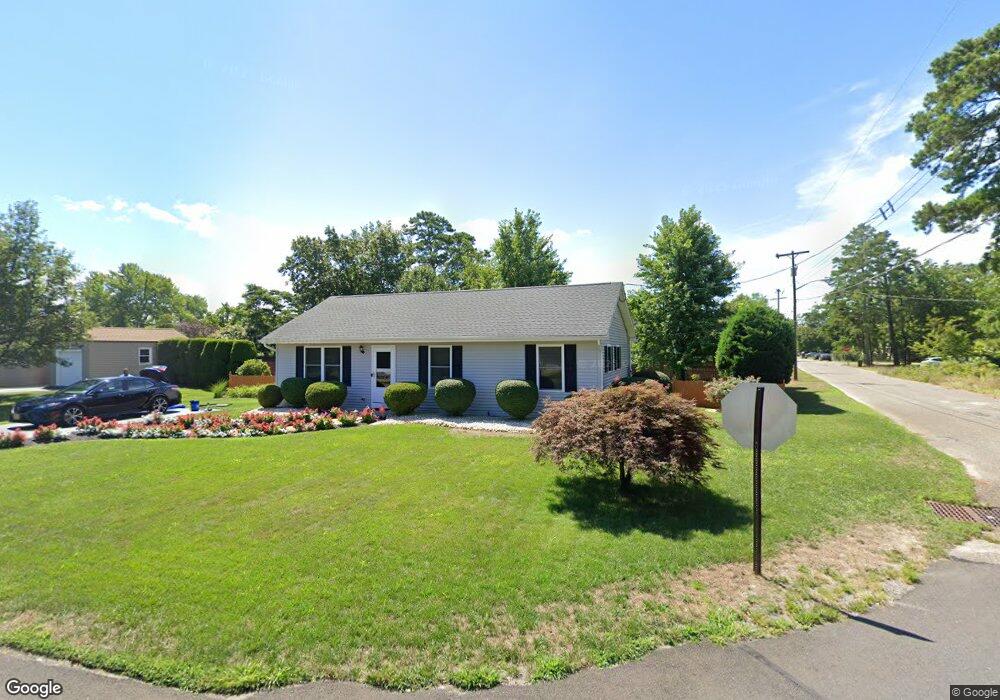
100 Chippewa Trail Browns Mills, NJ 08015
Estimated Value: $290,000 - $324,000
--
Bed
--
Bath
1,008
Sq Ft
$303/Sq Ft
Est. Value
About This Home
This home is located at 100 Chippewa Trail, Browns Mills, NJ 08015 and is currently estimated at $305,159, approximately $302 per square foot. 100 Chippewa Trail is a home located in Burlington County.
Ownership History
Date
Name
Owned For
Owner Type
Purchase Details
Closed on
Feb 7, 2008
Sold by
Green Vernon G and Green Carol J
Bought by
Marshall Theodore
Current Estimated Value
Home Financials for this Owner
Home Financials are based on the most recent Mortgage that was taken out on this home.
Original Mortgage
$163,606
Outstanding Balance
$101,786
Interest Rate
5.8%
Mortgage Type
Purchase Money Mortgage
Estimated Equity
$203,373
Purchase Details
Closed on
Feb 4, 1999
Sold by
Telehany Thomas P and Telehany Julie Q
Bought by
Green Vernon G and Green Carol J
Purchase Details
Closed on
Jun 30, 1997
Sold by
Jones Ronald W and Jones Phyllis R
Bought by
Telehany Thomas P
Home Financials for this Owner
Home Financials are based on the most recent Mortgage that was taken out on this home.
Original Mortgage
$87,720
Interest Rate
7.79%
Mortgage Type
VA
Create a Home Valuation Report for This Property
The Home Valuation Report is an in-depth analysis detailing your home's value as well as a comparison with similar homes in the area
Home Values in the Area
Average Home Value in this Area
Purchase History
| Date | Buyer | Sale Price | Title Company |
|---|---|---|---|
| Marshall Theodore | $164,900 | Fidelity Natl Title Ins Co | |
| Green Vernon G | $83,000 | Congress Title Corp | |
| Telehany Thomas P | $86,000 | -- |
Source: Public Records
Mortgage History
| Date | Status | Borrower | Loan Amount |
|---|---|---|---|
| Open | Marshall Theodore | $163,606 | |
| Previous Owner | Telehany Thomas P | $87,720 |
Source: Public Records
Tax History Compared to Growth
Tax History
| Year | Tax Paid | Tax Assessment Tax Assessment Total Assessment is a certain percentage of the fair market value that is determined by local assessors to be the total taxable value of land and additions on the property. | Land | Improvement |
|---|---|---|---|---|
| 2025 | $3,945 | $128,700 | $36,600 | $92,100 |
| 2024 | $3,701 | $128,700 | $36,600 | $92,100 |
| 2023 | $3,701 | $128,700 | $36,600 | $92,100 |
| 2022 | $3,426 | $128,700 | $36,600 | $92,100 |
| 2021 | $3,286 | $128,700 | $36,600 | $92,100 |
| 2020 | $3,162 | $128,700 | $36,600 | $92,100 |
| 2019 | $2,254 | $95,800 | $36,600 | $59,200 |
| 2018 | $2,178 | $95,800 | $36,600 | $59,200 |
| 2017 | $2,133 | $95,800 | $36,600 | $59,200 |
| 2016 | $2,149 | $57,500 | $23,700 | $33,800 |
| 2015 | $2,989 | $80,600 | $23,700 | $56,900 |
| 2014 | $2,857 | $80,600 | $23,700 | $56,900 |
Source: Public Records
Map
Nearby Homes
- 208 Wichita Trail
- 306 Apache Trail
- 6 Spring Terrace
- 206 Piute Trail
- 315 Algonquin Trail
- 317 Cayuga Trail
- 310 Piute Trail
- 304 Mohawk Trail
- 224 Cherokee Dr
- 203 Seneca Trail
- 1714 Red Feather Trail
- 14 Akwaala Trail
- 77 Sepulga Dr
- 406 Cherokee Dr
- 13 Muskogean Trail
- 22 Maricopa Trail
- 9 Winnebago Trail
- 111 Huckleberry Ln
- 2 Kiowa Trail
- 6 Cochita Trail
- 102 Chippewa Trail
- 101 Cherokee Dr
- 103 Cherokee Dr
- 38 Chippewa Trail
- 104 Chippewa Trail
- 109 Chippewa Trail
- 105 Cherokee Dr
- 111 Chippewa Trail
- 104 Algonquin Trail
- 107 Chippewa Trail
- 113 Chippewa Trail
- 106 Chippewa Trail
- 107 Cherokee Dr
- 105 Chippewa Trail
- 36 Chippewa Trail
- 29 Cherokee Dr
- 100 Cherokee Dr
- 102 Cherokee Dr
- 104 Cherokee Dr