
Seller's Agent in 2021
Caroline Molla
Costello Realty
(508) 954-9114
37 Total Sales
Estimated Value: $351,148 - $404,000
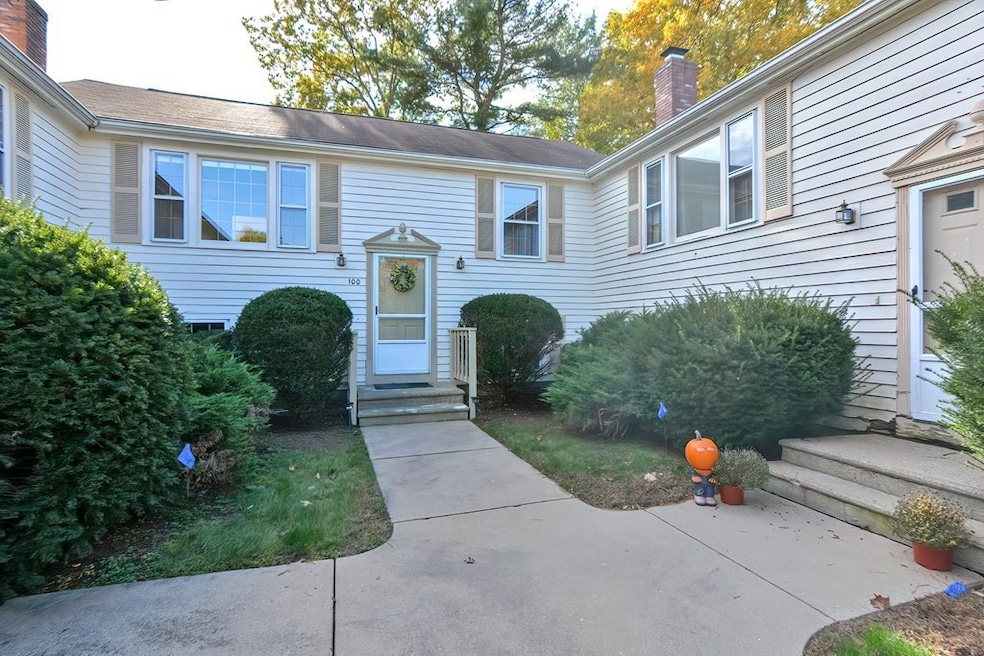
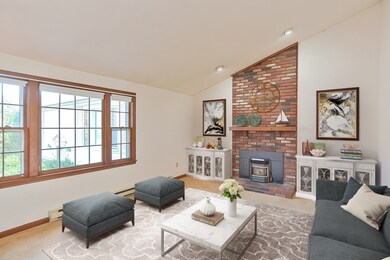
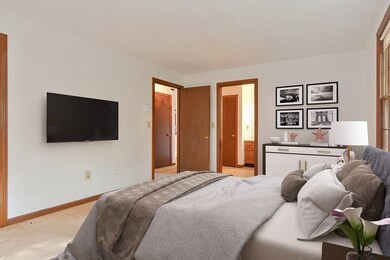
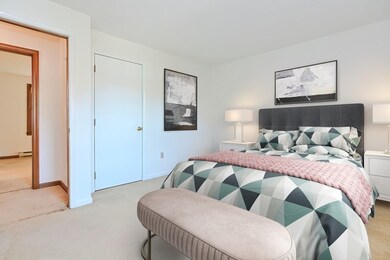
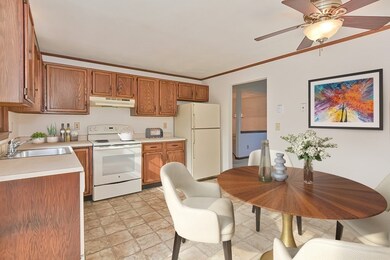
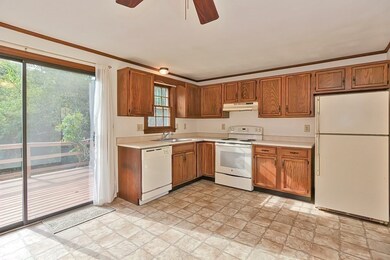
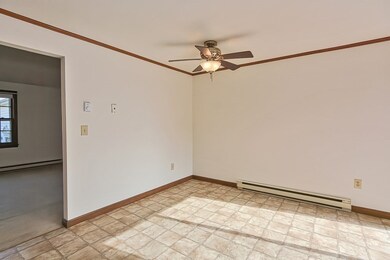
Now is your chance to own a great condo, located in a quiet neighborhood in Wrentham! This wonderful two bedroom one bath unit features a large Hollywood style bathroom connecting to the Master bedroom. Across the hall is the sun filled second bedroom. Enjoy the private back yard with lovely deck perfect for entertaining or having a morning cup of coffee. The living room features a beautiful fireplace and cathedral ceiling. You will appreciate the eat-in kitchen with slider door out to the porch that lets in an abundance of natural light. The unfinished basement allows for customized expansion or ample storage area. There are two unassigned parking spots in the driveway for the unit. Seller to offer up to $2,000 towards closing cost for flooring update. Dishwasher (2021) Interior Painting (2021) Water Heater (2021) Roof (approximately 10 years old) Unit is being sold as is, estate sale. Showings start immediately. WELCOME HOME! OFFER DEADLINE - NOON TUESDAY 11/9
| Date | Buyer | Sale Price | Title Company |
|---|---|---|---|
| Howarth Laura B | $291,000 | None Available | |
| Ober Loretta J | $94,900 | -- |
| Date | Status | Borrower | Loan Amount |
|---|---|---|---|
| Previous Owner | Ober Loretta J | $65,000 |
| Date | Event | Price | List to Sale | Price per Sq Ft |
|---|---|---|---|---|
| 12/15/2021 12/15/21 | Sold | $291,000 | +0.4% | $311 / Sq Ft |
| 11/10/2021 11/10/21 | Pending | -- | -- | -- |
| 11/04/2021 11/04/21 | For Sale | $289,900 | -- | $310 / Sq Ft |
| Year | Tax Paid | Tax Assessment Tax Assessment Total Assessment is a certain percentage of the fair market value that is determined by local assessors to be the total taxable value of land and additions on the property. | Land | Improvement |
|---|---|---|---|---|
| 2025 | $3,389 | $292,400 | $0 | $292,400 |
| 2024 | $3,292 | $274,300 | $0 | $274,300 |
| 2023 | $3,396 | $269,100 | $0 | $269,100 |
| 2022 | $3,039 | $222,300 | $0 | $222,300 |
| 2021 | $2,898 | $206,000 | $0 | $206,000 |
| 2020 | $2,826 | $198,300 | $0 | $198,300 |
| 2019 | $2,800 | $198,300 | $0 | $198,300 |
| 2018 | $2,915 | $204,700 | $0 | $204,700 |
| 2017 | $2,839 | $199,200 | $0 | $199,200 |
| 2016 | $2,737 | $191,700 | $0 | $191,700 |
| 2015 | $2,409 | $160,800 | $0 | $160,800 |
| 2014 | $2,489 | $162,600 | $0 | $162,600 |
Seller's Agent in 2021
Caroline Molla
Costello Realty
(508) 954-9114
37 Total Sales
K
Buyer's Agent in 2021
Kara Trombly
Realty ONE Group Suburban Lifestyle
(781) 710-7561
35 Total Sales
Source: MLS Property Information Network (MLS PIN)
MLS Number: 72916447
APN: WREN-000009N-000016-000002
Disclaimer: Certain information contained herein is derived from information provided by parties other than Homes.com. All information provided is deemed reliable, but is not guaranteed to be accurate and should be independently verified.
![]() The property listing data and information, or the Images, set forth herein were provided to MLS Property Information Network, Inc. from third party sources, including sellers, lessors and public records, and were compiled by MLS Property Information Network, Inc. The property listing data and information, and the Images, are for the personal, non-commercial use of consumers having a good faith interest in purchasing or leasing listed properties of the type displayed to them and may not be used for any purpose other than to identify prospective properties which such consumers may have a good faith interest in purchasing or leasing. MLS Property Information Network, Inc. and its subscribers disclaim any and all representations and warranties as to the accuracy of the property listing data and information, or as to the accuracy of any of the Images, set forth herein.
The property listing data and information, or the Images, set forth herein were provided to MLS Property Information Network, Inc. from third party sources, including sellers, lessors and public records, and were compiled by MLS Property Information Network, Inc. The property listing data and information, and the Images, are for the personal, non-commercial use of consumers having a good faith interest in purchasing or leasing listed properties of the type displayed to them and may not be used for any purpose other than to identify prospective properties which such consumers may have a good faith interest in purchasing or leasing. MLS Property Information Network, Inc. and its subscribers disclaim any and all representations and warranties as to the accuracy of the property listing data and information, or as to the accuracy of any of the Images, set forth herein.
Ask me questions while you tour the home.