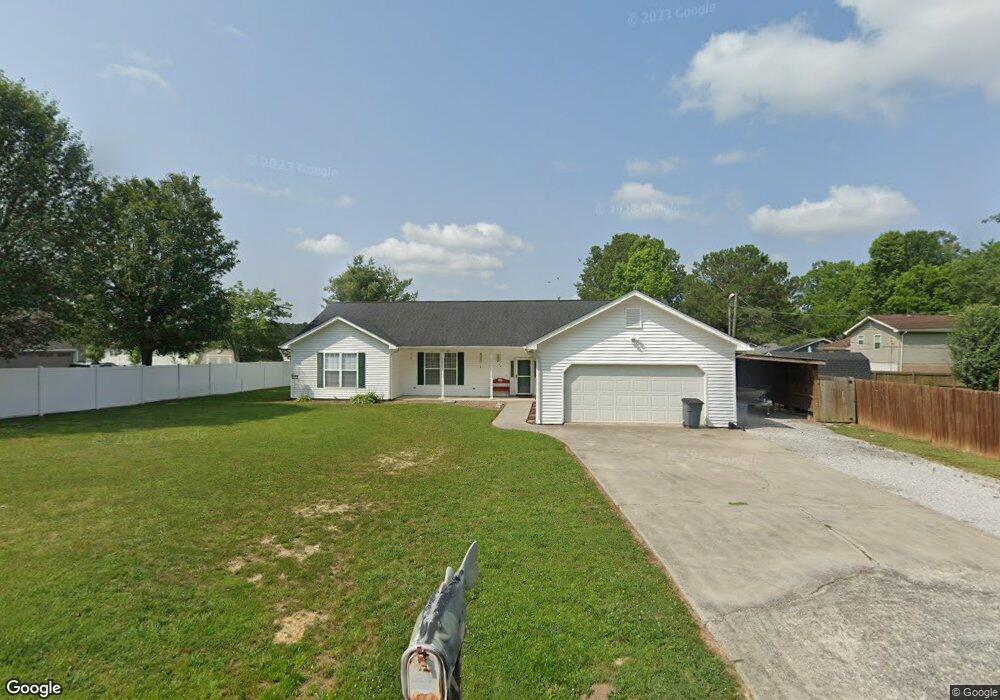
100 Coleman Ln Chickamauga, GA 30707
Estimated Value: $255,000 - $381,000
Studio
2
Baths
2,277
Sq Ft
$130/Sq Ft
Est. Value
About This Home
This home is located at 100 Coleman Ln, Chickamauga, GA 30707 and is currently estimated at $296,042, approximately $130 per square foot. 100 Coleman Ln is a home located in Walker County with nearby schools including Cherokee Ridge Elementary School, Rossville Middle School, and Ridgeland High School.
Ownership History
Date
Name
Owned For
Owner Type
Purchase Details
Closed on
Aug 4, 2006
Sold by
Scenic City Builders Inc
Bought by
Carlock Brian K
Current Estimated Value
Home Financials for this Owner
Home Financials are based on the most recent Mortgage that was taken out on this home.
Original Mortgage
$80,000
Outstanding Balance
$47,612
Interest Rate
6.6%
Mortgage Type
New Conventional
Estimated Equity
$248,430
Purchase Details
Closed on
Jan 3, 1998
Sold by
Houston Larry C and Houston Evelyn P
Bought by
Spaulding Daniel J and Spaulding Terri J
Purchase Details
Closed on
Jan 2, 1998
Sold by
Rankin Larry and Rankin Betty
Bought by
Houston Larry C and Houston Evelyn P
Purchase Details
Closed on
Jul 29, 1994
Sold by
Reynolds Mark and Lynn Rankin
Bought by
Rankin Larry and Rankin Betty
Purchase Details
Closed on
Nov 16, 1993
Sold by
Harlow Patrick E and Harlow Peggy
Bought by
Reynolds Mark and Lynn Rankin
Purchase Details
Closed on
Jun 18, 1991
Sold by
Ryan Michael L and Ryan Cynthia
Bought by
Harlow Patrick E and Harlow Peggy
Purchase Details
Closed on
Jan 1, 1972
Bought by
Ryan Michael L and Ryan Cynthia
Create a Home Valuation Report for This Property
The Home Valuation Report is an in-depth analysis detailing your home's value as well as a comparison with similar homes in the area
Home Values in the Area
Average Home Value in this Area
Purchase History
| Date | Buyer | Sale Price | Title Company |
|---|---|---|---|
| Carlock Brian K | $187,900 | -- | |
| Spaulding Daniel J | -- | -- | |
| Houston Larry C | -- | -- | |
| Rankin Larry | $8,500 | -- | |
| Reynolds Mark | $85,000 | -- | |
| Harlow Patrick E | $6,000 | -- | |
| Ryan Michael L | -- | -- |
Source: Public Records
Mortgage History
| Date | Status | Borrower | Loan Amount |
|---|---|---|---|
| Open | Carlock Brian K | $80,000 |
Source: Public Records
Tax History
| Year | Tax Paid | Tax Assessment Tax Assessment Total Assessment is a certain percentage of the fair market value that is determined by local assessors to be the total taxable value of land and additions on the property. | Land | Improvement |
|---|---|---|---|---|
| 2024 | $2,320 | $100,546 | $3,408 | $97,138 |
| 2023 | $2,322 | $98,659 | $3,408 | $95,251 |
| 2022 | $2,160 | $85,213 | $3,408 | $81,805 |
| 2021 | $1,975 | $69,971 | $3,408 | $66,563 |
| 2020 | $1,628 | $54,484 | $3,408 | $51,076 |
| 2019 | $1,656 | $54,484 | $3,408 | $51,076 |
| 2018 | $1,442 | $54,484 | $3,408 | $51,076 |
| 2017 | $1,807 | $54,484 | $3,408 | $51,076 |
| 2016 | $1,414 | $54,484 | $3,408 | $51,076 |
| 2015 | $1,488 | $54,138 | $3,864 | $50,274 |
| 2014 | $1,380 | $54,138 | $3,864 | $50,274 |
| 2013 | -- | $54,138 | $3,864 | $50,274 |
Source: Public Records
Map
Nearby Homes
- 100 Myers St
- 130 Arlington Dr
- Southport Plan at
- Aria Plan at Cambridge Cove
- Bayshore Plan at
- 124 Arlington Dr
- 116 Arlington Dr
- 108 Arlington Dr
- 100 Arlington Dr
- 94 Arlington Dr
- 84 Arlington Dr
- 107 Hamel Dr
- 550 Osborn Rd
- 5.28 ACRES Johnson Rd
- 801 Thomas Ave
- 90 Park St
- 138 Dana Ln
- 8 W 8th St
- 1228 Vittetoe Rd
- 102 W 8th St
- 102 Coleman Ln
- 236 Wilder Rd
- 230 Wilder Rd
- 432 Heritage Dr Unit 1A
- 432 Heritage Dr
- 430 Heritage Dr
- 430 Heritage Dr Unit 1B
- 416 Heritage Dr
- 416 Heritage Dr Unit 2A
- 228 Wilder Rd
- 414 Heritage Dr
- 414 Heritage Dr Unit 2B
- 242 Wilder Rd
- 398 Heritage Dr
- 238 Wilder Rd
- 103 Coleman Ln
- 226 Wilder Rd
- 396 Heritage Dr
- 239 Wilder Rd
- 378 Heritage Dr