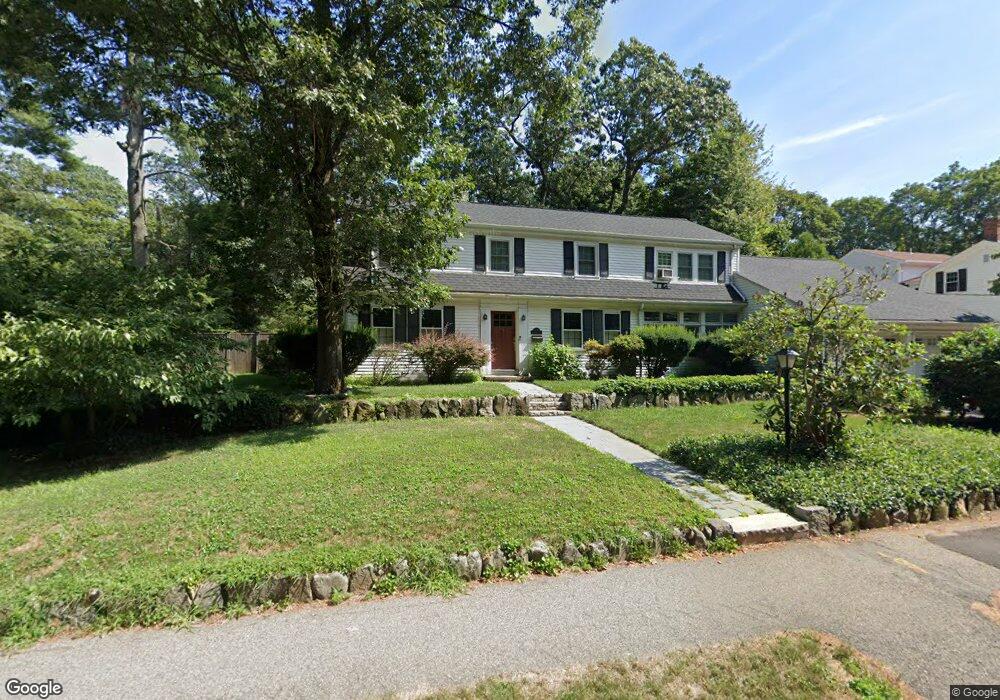
100 Concord St Newton Lower Falls, MA 02462
Newton Lower Falls NeighborhoodEstimated Value: $1,551,000 - $1,730,440
3
Beds
3
Baths
2,354
Sq Ft
$698/Sq Ft
Est. Value
About This Home
This home is located at 100 Concord St, Newton Lower Falls, MA 02462 and is currently estimated at $1,644,110, approximately $698 per square foot. 100 Concord St is a home located in Middlesex County with nearby schools including Angier Elementary School, Charles E Brown Middle School, and Newton South High School.
Ownership History
Date
Name
Owned For
Owner Type
Purchase Details
Closed on
Jun 1, 2023
Sold by
Kandamar Ozan and Kandamar Erin L
Bought by
Erin L Kandamar Lt and Kandamar
Current Estimated Value
Purchase Details
Closed on
Apr 4, 2008
Sold by
Argyres Laura I and Argyres Nicholas S
Bought by
Kandamar Erin L and Kandamar Ozan
Home Financials for this Owner
Home Financials are based on the most recent Mortgage that was taken out on this home.
Original Mortgage
$596,250
Interest Rate
6.06%
Mortgage Type
Purchase Money Mortgage
Purchase Details
Closed on
Nov 23, 2004
Sold by
Hopkins Jeanne L and Bernardi John A
Bought by
Argyres Laura I and Argyres Nicholas S
Purchase Details
Closed on
Jun 28, 1999
Sold by
Hailer Nt and Hailer
Bought by
Bernardi John A and Hopkins Jeanne L
Purchase Details
Closed on
May 3, 1991
Sold by
Mannix William J and Mannix Joan C
Bought by
Hailer Robert C and Hailer Marilyn M<
Create a Home Valuation Report for This Property
The Home Valuation Report is an in-depth analysis detailing your home's value as well as a comparison with similar homes in the area
Home Values in the Area
Average Home Value in this Area
Purchase History
| Date | Buyer | Sale Price | Title Company |
|---|---|---|---|
| Erin L Kandamar Lt | -- | None Available | |
| Kandamar Erin L | $795,000 | -- | |
| Argyres Laura I | $769,000 | -- | |
| Bernardi John A | $472,000 | -- | |
| Hailer Robert C | $235,000 | -- |
Source: Public Records
Mortgage History
| Date | Status | Borrower | Loan Amount |
|---|---|---|---|
| Previous Owner | Hailer Robert C | $51,800 | |
| Previous Owner | Hailer Robert C | $523,750 | |
| Previous Owner | Kandamar Erin L | $596,250 |
Source: Public Records
Tax History Compared to Growth
Tax History
| Year | Tax Paid | Tax Assessment Tax Assessment Total Assessment is a certain percentage of the fair market value that is determined by local assessors to be the total taxable value of land and additions on the property. | Land | Improvement |
|---|---|---|---|---|
| 2025 | $14,302 | $1,459,400 | $839,200 | $620,200 |
| 2024 | $13,829 | $1,416,900 | $814,800 | $602,100 |
| 2023 | $13,211 | $1,297,700 | $638,000 | $659,700 |
| 2022 | $12,641 | $1,201,600 | $590,700 | $610,900 |
| 2021 | $11,177 | $1,038,800 | $557,300 | $481,500 |
| 2020 | $10,030 | $960,700 | $557,300 | $403,400 |
| 2019 | $9,747 | $932,700 | $541,100 | $391,600 |
| 2018 | $9,361 | $865,200 | $481,200 | $384,000 |
| 2017 | $9,076 | $816,200 | $454,000 | $362,200 |
| 2016 | $8,667 | $761,600 | $424,300 | $337,300 |
| 2015 | $8,264 | $711,800 | $396,500 | $315,300 |
Source: Public Records
Map
Nearby Homes
- 5 Grayson Ln
- 11 Grayson Ln
- 38 Swallow Dr
- 577 Grove St
- 25 Columbia St
- 45 Moulton St
- 17 Deforest Rd
- 32 Intervale Rd
- 33 Boulder Rd
- 81 River St
- 8 Old Town Rd
- 2 Longfellow Rd
- 135 Orchard Ave
- 12 Bird Hill Ave
- 45 E Quinobequin Rd
- 38 E Quinobequin Rd
- 17 Longfellow Rd
- 10 Bird Hill Ave
- 14 Bird Hill Ave
- 56 Ridgeway Rd
- 108 Concord St
- 46 Lafayette Rd
- 86 Concord St
- 40 Lafayette Rd
- 45 Lafayette Rd
- 82 Concord St
- 73 Saint Marys St
- 79 Saint Marys St
- 122 Concord St
- 34 Lafayette Rd
- 67 Saint Marys St
- 39 Lafayette Rd
- 72 Concord St
- 61 Saint Marys St
- 31 Lafayette Rd
- 55 Saint Marys St
- 25 Lafayette Rd
- 66 Concord St
- 22 Lafayette Rd
- 49 Saint Marys St