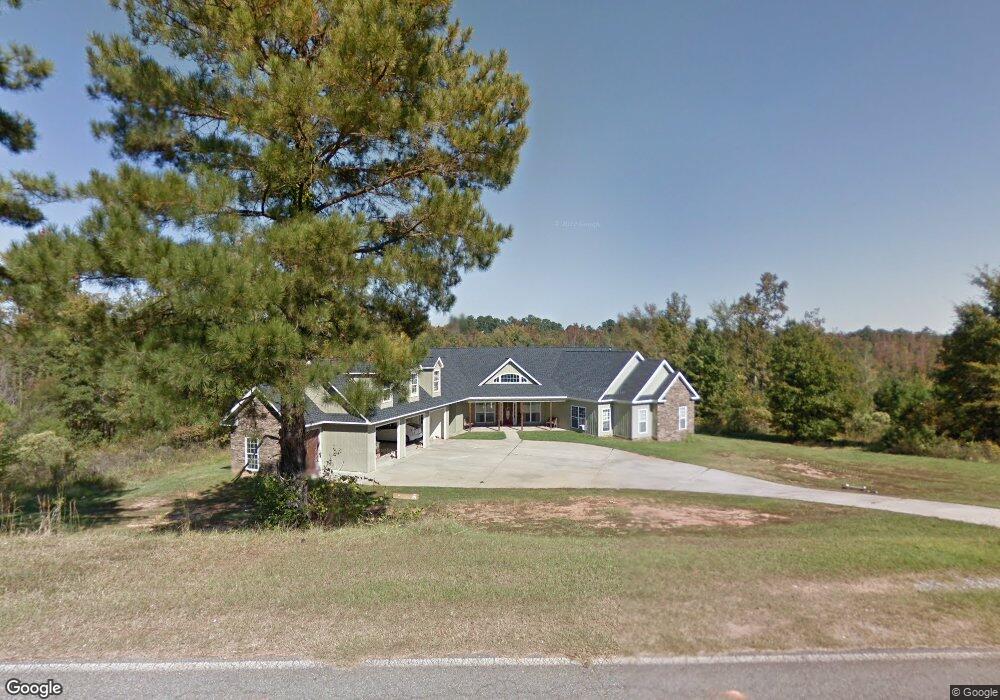
100 Cords Bridge Rd NE Milledgeville, GA 31061
Estimated Value: $565,000 - $842,000
4
Beds
5
Baths
4,010
Sq Ft
$176/Sq Ft
Est. Value
About This Home
This home is located at 100 Cords Bridge Rd NE, Milledgeville, GA 31061 and is currently estimated at $705,233, approximately $175 per square foot. 100 Cords Bridge Rd NE is a home located in Baldwin County with nearby schools including Lakeview Primary, Lakeview Academy, and Oak Hill Middle School.
Ownership History
Date
Name
Owned For
Owner Type
Purchase Details
Closed on
Jul 27, 2021
Sold by
Beckhams Financial Enterprises Inc
Bought by
Mills Melinda Karen
Current Estimated Value
Home Financials for this Owner
Home Financials are based on the most recent Mortgage that was taken out on this home.
Original Mortgage
$452,105
Outstanding Balance
$411,103
Interest Rate
2.9%
Mortgage Type
New Conventional
Estimated Equity
$294,130
Purchase Details
Closed on
Dec 30, 2020
Sold by
Kicklighter Melinda
Bought by
Beckhams Financial
Purchase Details
Closed on
May 26, 2010
Sold by
Adams Tyree T
Bought by
Kicklighter Melinda
Purchase Details
Closed on
Jul 12, 2007
Sold by
Adams Tyree T
Bought by
Adams Tyree T and Adams Melissa
Purchase Details
Closed on
Apr 19, 2004
Sold by
Green Development In
Bought by
Craig William
Purchase Details
Closed on
Dec 21, 1995
Bought by
Green Development In
Create a Home Valuation Report for This Property
The Home Valuation Report is an in-depth analysis detailing your home's value as well as a comparison with similar homes in the area
Home Values in the Area
Average Home Value in this Area
Purchase History
| Date | Buyer | Sale Price | Title Company |
|---|---|---|---|
| Mills Melinda Karen | $475,900 | -- | |
| Beckhams Financial | $142,468 | -- | |
| Kicklighter Melinda | $260,000 | -- | |
| Adams Tyree T | -- | -- | |
| Craig William | $42,000 | -- | |
| Green Development In | $1,200,000 | -- |
Source: Public Records
Mortgage History
| Date | Status | Borrower | Loan Amount |
|---|---|---|---|
| Open | Mills Melinda Karen | $452,105 |
Source: Public Records
Tax History Compared to Growth
Tax History
| Year | Tax Paid | Tax Assessment Tax Assessment Total Assessment is a certain percentage of the fair market value that is determined by local assessors to be the total taxable value of land and additions on the property. | Land | Improvement |
|---|---|---|---|---|
| 2025 | $9,307 | $261,224 | $14,400 | $246,824 |
| 2024 | $9,307 | $261,224 | $14,400 | $246,824 |
| 2023 | $4,019 | $190,360 | $10,040 | $180,320 |
| 2022 | $4,420 | $190,360 | $10,040 | $180,320 |
| 2021 | $1,494 | $56,960 | $3,400 | $53,560 |
| 2020 | $3,349 | $153,360 | $12,000 | $141,360 |
| 2019 | $3,356 | $153,360 | $12,000 | $141,360 |
| 2018 | $3,367 | $153,360 | $12,000 | $141,360 |
| 2017 | $3,333 | $153,360 | $12,000 | $141,360 |
| 2016 | $3,518 | $140,720 | $16,000 | $124,720 |
| 2015 | $3,518 | $142,920 | $16,000 | $126,920 |
| 2014 | $3,859 | $142,920 | $16,000 | $126,920 |
Source: Public Records
Map
Nearby Homes
- 103 Cords Bridge Rd NE
- 130 Arlington Ct
- 99 Sweetgum Dr
- 139 Cords Bridge Rd NE
- 330 Greystone Dr
- 121 Marshall Rd NE
- 121 Marshall Rd
- 291 Greystone Dr
- 211 Arbor Way
- 270 Greystone Dr
- 260 Greystone Dr
- 250 Greystone Dr
- 141 Arbor Way
- 211 Greystone Dr
- 131 Carriage Ct NE
- 201 Greystone Dr
- 175 Greystone Dr
- 0 Georgia 24
- 2700 N Columbia St
- 2090 N Jefferson St NE
- 159 Pearl Dr NE Unit 2
- 101 Cords Bridge Rd NE
- 104 Cords Bridge Rd NE
- 158 Pearl Dr NE
- 161 Pearl Dr NE Unit 2
- 101 Arlington Ct Unit 1
- 160 Pearl Dr NE
- 115 Sweetgum Dr NE
- 114 Sweetgum Dr NE
- 111 Arlington Ct Unit 2-1
- 111 Arlington Ct
- 163 Pearl Dr NE Unit 2
- 121 Arlington Ct Unit 3
- 100 Arlington Ct
- 121 Green Lake Dr NE
- 110 Arlington Ct Unit 11
- 112 Sweetgum Dr NE
- 131 Arlington Ct
- 167 Pearl Dr NE Unit 5&5 LKE
- 167 Pearl Dr NE