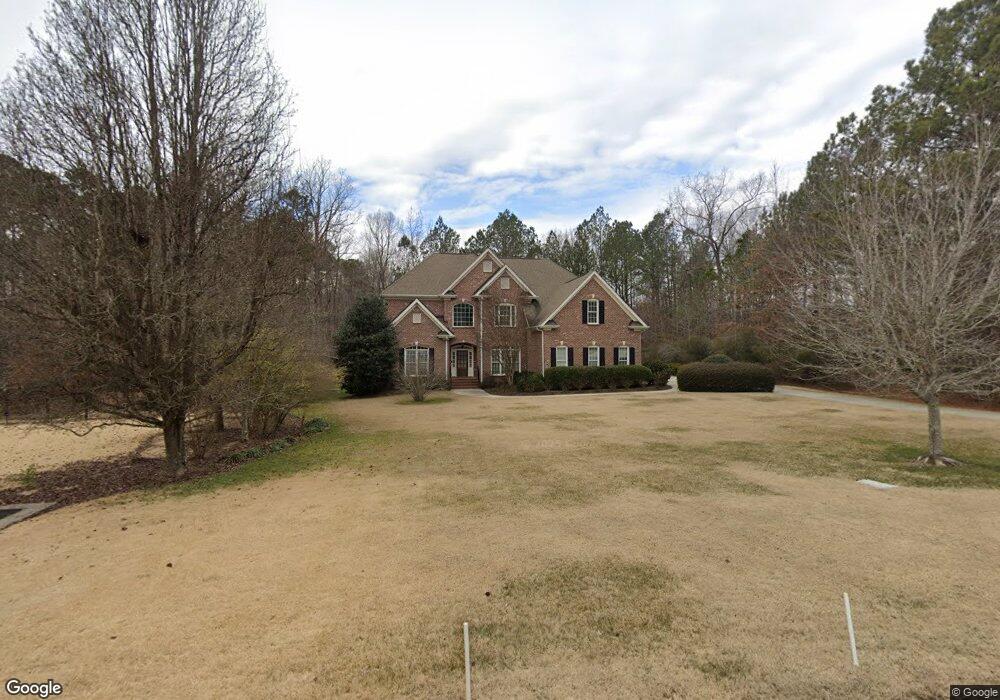
100 Crooked Creek Ln Durham, NC 27713
Estimated Value: $1,027,997 - $1,298,000
5
Beds
4
Baths
3,790
Sq Ft
$297/Sq Ft
Est. Value
About This Home
This home is located at 100 Crooked Creek Ln, Durham, NC 27713 and is currently estimated at $1,126,749, approximately $297 per square foot. 100 Crooked Creek Ln is a home located in Chatham County with nearby schools including North Chatham Elementary School, Margaret B. Pollard Middle School, and Southpoint Academy.
Ownership History
Date
Name
Owned For
Owner Type
Purchase Details
Closed on
Dec 7, 2020
Sold by
El Khalick Fouad Sami Abd and Boufajreldin Lama
Bought by
Abd El Khalick Fouad Sami and Lama Boufajreldin
Current Estimated Value
Purchase Details
Closed on
Mar 27, 2017
Sold by
Dudley Victor W and Dudley Nelcine M
Bought by
Lama Abd El Khalick Fouad Sami and Lama Boufajreldin
Home Financials for this Owner
Home Financials are based on the most recent Mortgage that was taken out on this home.
Original Mortgage
$598,734
Outstanding Balance
$495,171
Interest Rate
4.16%
Mortgage Type
New Conventional
Estimated Equity
$631,578
Purchase Details
Closed on
Mar 10, 2005
Sold by
Alex Mitchell Contruction Inc
Bought by
Dudley Victor W and Dudley Nelcine M
Home Financials for this Owner
Home Financials are based on the most recent Mortgage that was taken out on this home.
Original Mortgage
$100,000
Interest Rate
5.6%
Mortgage Type
New Conventional
Create a Home Valuation Report for This Property
The Home Valuation Report is an in-depth analysis detailing your home's value as well as a comparison with similar homes in the area
Home Values in the Area
Average Home Value in this Area
Purchase History
| Date | Buyer | Sale Price | Title Company |
|---|---|---|---|
| Abd El Khalick Fouad Sami | -- | None Available | |
| Lama Abd El Khalick Fouad Sami | $666,000 | Attorney | |
| Dudley Victor W | $619,000 | None Available |
Source: Public Records
Mortgage History
| Date | Status | Borrower | Loan Amount |
|---|---|---|---|
| Open | Lama Abd El Khalick Fouad Sami | $598,734 | |
| Previous Owner | Dudley Victor W | $100,000 |
Source: Public Records
Tax History Compared to Growth
Tax History
| Year | Tax Paid | Tax Assessment Tax Assessment Total Assessment is a certain percentage of the fair market value that is determined by local assessors to be the total taxable value of land and additions on the property. | Land | Improvement |
|---|---|---|---|---|
| 2025 | $6,713 | $957,890 | $227,070 | $730,820 |
| 2024 | $6,713 | $632,743 | $168,200 | $464,543 |
| 2023 | $5,420 | $632,743 | $168,200 | $464,543 |
| 2022 | $5,029 | $632,743 | $168,200 | $464,543 |
| 2021 | $5,029 | $632,743 | $168,200 | $464,543 |
| 2020 | $4,722 | $589,364 | $180,000 | $409,364 |
| 2019 | $4,722 | $589,364 | $180,000 | $409,364 |
| 2018 | $4,416 | $589,364 | $180,000 | $409,364 |
| 2017 | $4,347 | $589,364 | $180,000 | $409,364 |
| 2016 | $4,445 | $589,364 | $180,000 | $409,364 |
| 2015 | $4,434 | $589,364 | $180,000 | $409,364 |
| 2014 | $4,380 | $589,364 | $180,000 | $409,364 |
| 2013 | -- | $589,364 | $180,000 | $409,364 |
Source: Public Records
Map
Nearby Homes
- 132 Crooked Creek Ln
- 32 Woodgate Ct
- 128 Colvard Park Dr
- 219 Colvard Park Dr
- 271 Crimson Oak Dr
- 2 Barkwood Ct
- 6 Castlewood Dr
- 504 Colvard Woods Way
- 604 Dappled Pine Ave
- 282 Colvard Estates Dr
- 616 Dappled Pine Ave
- 107 Edward Booth Ln
- The Oberlin Plan at Colvard Farms
- 1017 Whitehall Cir
- 818 Saint Charles St
- 1002 Kentlands Dr
- 512 Whitehall Cir
- Schubert Plan at 751 South
- 916 Noisette Ct
- 139 Callowhill Ln
- 120 Crooked Creek Ln
- 86 Crooked Creek Ln
- 64 Crooked Creek Ln
- 145 Crooked Creek Ln
- 44 Crooked Creek Ln
- 146 Crooked Creek Ln
- 23 Woodgate Ct
- 59 Crooked Creek Ln
- 31 Woodgate Ct
- 18 Crooked Creek Ln
- 95 Crooked Creek Ln
- 123 Crooked Creek Ln
- 89 Crooked Creek Ln
- 43 Crooked Creek Ln
- 135 Crooked Creek Ln
- 17 Woodgate Ct
- 19 Crooked Creek Ln
- 110 Winding Ridge Rd
- 20 Woodgate Ct
- 94 Winding Ridge Rd