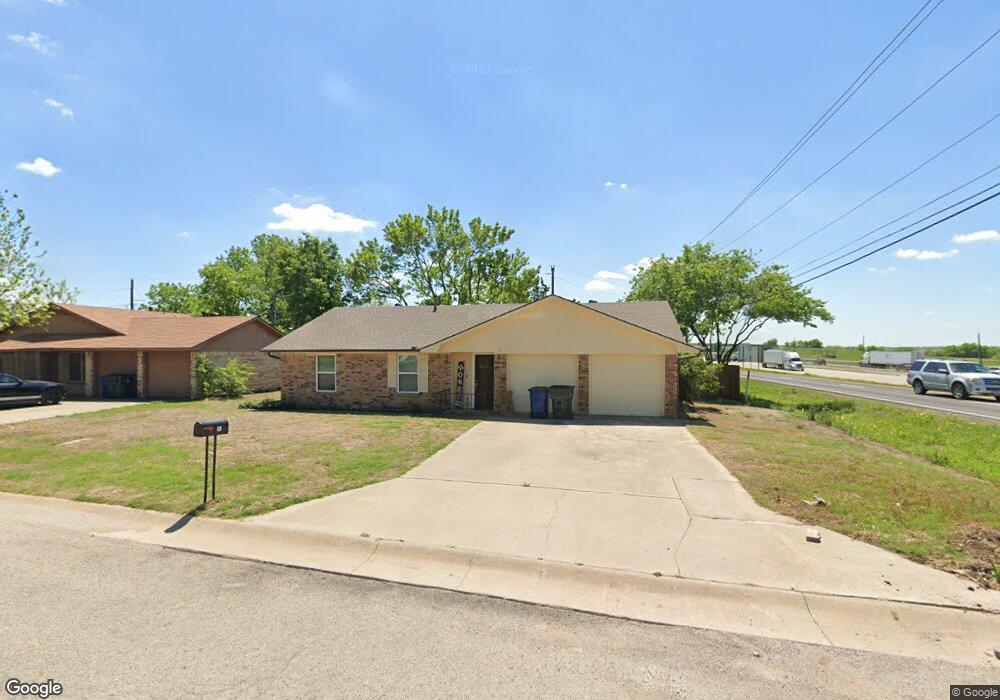
100 David Dr Sanger, TX 76266
Estimated Value: $221,940 - $263,000
3
Beds
1
Bath
1,216
Sq Ft
$201/Sq Ft
Est. Value
About This Home
This home is located at 100 David Dr, Sanger, TX 76266 and is currently estimated at $244,485, approximately $201 per square foot. 100 David Dr is a home located in Denton County with nearby schools including Chisholm Trail Elementary School, Clear Creek Intermediate School, and Sanger Sixth Grade Campus.
Ownership History
Date
Name
Owned For
Owner Type
Purchase Details
Closed on
Aug 29, 2002
Sold by
Melton Thomas A and Melton Ovella
Bought by
Mcneal Mark Allen and Mcneal Kim Eileen
Current Estimated Value
Home Financials for this Owner
Home Financials are based on the most recent Mortgage that was taken out on this home.
Original Mortgage
$60,250
Interest Rate
6.47%
Purchase Details
Closed on
Aug 23, 2002
Sold by
Melton Thomas Joe and Reynolds Joyce Lee
Bought by
Melton Thomas A
Home Financials for this Owner
Home Financials are based on the most recent Mortgage that was taken out on this home.
Original Mortgage
$60,250
Interest Rate
6.47%
Purchase Details
Closed on
Aug 19, 2002
Sold by
Melton Thomas Joe and Reynolds Joyce Lee
Bought by
Melton Thomas A
Home Financials for this Owner
Home Financials are based on the most recent Mortgage that was taken out on this home.
Original Mortgage
$60,250
Interest Rate
6.47%
Purchase Details
Closed on
Sep 9, 1999
Sold by
Melton Thomas A
Bought by
Melton Thomas Joe and Reynolds Joyce Lee
Create a Home Valuation Report for This Property
The Home Valuation Report is an in-depth analysis detailing your home's value as well as a comparison with similar homes in the area
Home Values in the Area
Average Home Value in this Area
Purchase History
| Date | Buyer | Sale Price | Title Company |
|---|---|---|---|
| Mcneal Mark Allen | -- | -- | |
| Melton Thomas A | -- | -- | |
| Melton Thomas A | -- | -- | |
| Melton Thomas Joe | -- | -- |
Source: Public Records
Mortgage History
| Date | Status | Borrower | Loan Amount |
|---|---|---|---|
| Closed | Mcneal Mark Allen | $60,250 |
Source: Public Records
Tax History Compared to Growth
Tax History
| Year | Tax Paid | Tax Assessment Tax Assessment Total Assessment is a certain percentage of the fair market value that is determined by local assessors to be the total taxable value of land and additions on the property. | Land | Improvement |
|---|---|---|---|---|
| 2025 | $3,698 | $162,003 | $69,540 | $92,463 |
| 2024 | $3,698 | $182,955 | $69,540 | $113,415 |
| 2023 | $3,628 | $179,000 | $49,391 | $129,609 |
| 2022 | $3,701 | $166,891 | $52,155 | $114,736 |
| 2021 | $2,545 | $121,107 | $34,770 | $86,337 |
| 2020 | $2,655 | $120,000 | $34,770 | $85,230 |
| 2019 | $2,732 | $120,000 | $34,770 | $85,230 |
| 2018 | $2,423 | $105,875 | $34,770 | $71,105 |
| 2017 | $2,336 | $101,565 | $34,770 | $66,795 |
| 2016 | $2,325 | $78,591 | $17,713 | $60,878 |
| 2015 | $1,567 | $75,341 | $17,713 | $57,628 |
| 2014 | $1,567 | $67,437 | $17,713 | $49,724 |
| 2013 | -- | $68,017 | $17,713 | $50,304 |
Source: Public Records
Map
Nearby Homes
- 209 Southland Dr
- 113 Diane Dr
- 212 Diane Dr
- 202 Southland Dr
- 226 Hillcrest St
- 109 Colonial Heights
- 2000 S Stemmons St
- 130 Southside Dr
- 141 Shady Grove Dr
- 2004 S Stemmons St
- 505 Houston St
- 144 Prairie Dr
- 106 W Holt St
- 319 Austin St
- 321 Quail Crossing Dr
- 710 W Willow St
- 411 Hughes St
- 509 Marshall St
- 319 Quail Crossing Dr
- 124 Morning Glory