Estimated Value: $486,714 - $564,000
3
Beds
2
Baths
1,701
Sq Ft
$306/Sq Ft
Est. Value
About This Home
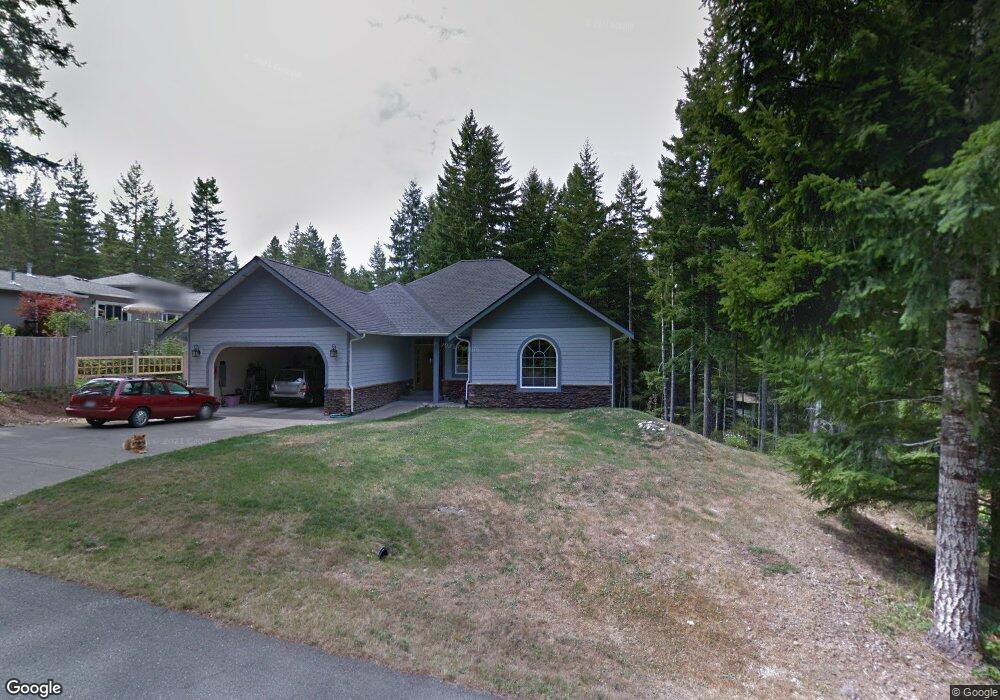
This home is located at 100 E Hemlock Ln, Union, WA 98592 and is currently estimated at $520,429, approximately $305 per square foot. 100 E Hemlock Ln is a home located in Mason County with nearby schools including Hood Canal Elementary/Junior High School.
Ownership History
Date
Name
Owned For
Owner Type
Purchase Details
Closed on
Feb 3, 2022
Sold by
Alderbrook Properties Llc
Bought by
Ab Fine Homes Llc
Current Estimated Value
Purchase Details
Closed on
Feb 1, 2012
Sold by
Oblizalo Mike
Bought by
Oblizalo John and Oblizalo Jody
Purchase Details
Closed on
Apr 20, 2011
Sold by
Indymac Venture Llc
Bought by
Oblizalo John T and Oblizalo Jody A
Purchase Details
Closed on
Jul 27, 2009
Sold by
Moss Blake F P
Bought by
Indymac Bank Fsb
Purchase Details
Closed on
Jan 19, 2006
Sold by
Moss Blake F P and Moss Lisa D
Bought by
Moss Blake F P
Purchase Details
Closed on
Feb 3, 2005
Sold by
Quillin James W
Bought by
Moss Blake F P and Moss Lisa D
Create a Home Valuation Report for This Property
The Home Valuation Report is an in-depth analysis detailing your home's value as well as a comparison with similar homes in the area
Purchase History
| Date | Buyer | Sale Price | Title Company |
|---|---|---|---|
| Ab Fine Homes Llc | -- | Accommodation/Courtesy Recordi | |
| Oblizalo John | -- | None Listed On Document | |
| Oblizalo Mike | -- | None Available | |
| Oblizalo John T | $55,000 | Land Title Co | |
| Indymac Bank Fsb | $115,000 | First American Title | |
| Moss Blake F P | -- | Land Title Co | |
| Moss Blake F P | $22,823 | Mason County Title Ins Co |
Source: Public Records
Tax History
| Year | Tax Paid | Tax Assessment Tax Assessment Total Assessment is a certain percentage of the fair market value that is determined by local assessors to be the total taxable value of land and additions on the property. | Land | Improvement |
|---|---|---|---|---|
| 2025 | $3,722 | $513,855 | $43,890 | $469,965 |
| 2023 | $3,722 | $513,525 | $27,345 | $486,180 |
| 2022 | $3,736 | $394,430 | $8,440 | $385,990 |
| 2021 | $3,396 | $394,430 | $8,440 | $385,990 |
| 2020 | $3,591 | $320,740 | $4,825 | $315,915 |
| 2018 | $2,570 | $235,405 | $42,170 | $193,235 |
| 2017 | $2,507 | $235,205 | $41,970 | $193,235 |
| 2016 | $2,571 | $239,725 | $39,760 | $199,965 |
| 2015 | $2,629 | $252,010 | $41,970 | $210,040 |
| 2014 | -- | $254,220 | $44,180 | $210,040 |
| 2013 | -- | $248,040 | $38,000 | $210,040 |
Source: Public Records
Map
Nearby Homes
- 161 E Hemlock Ln
- 30 E Hemlock Ln
- 350 E Vine Maple Ln
- 20 E Laurel Park
- 71 E Hemlock Ct
- 31 E Rhododendron Ct
- 700 E Vine Maple Ln
- 50 E Laurel Park
- 110 E Rhododendron Ln
- 50 E Eastwood Ln
- 1250 E Vine Maple Ln
- 21 E Eastwood Ln
- 91 E Jack Pine Ln
- 1190 E Manzanita Dr
- 33 E Michelle Ct
- 121 E Fir Tree Ln
- 231 E Blackberry Ln
- 100 E Fir Tree Ln
- 40 E Paint Brush Ln
- 1031 E Manzanita Dr
- 20 E Hemlock Ct
- 30 E Hemlock Ct
- 80 E Hemlock Ln
- 0 XXX E Hemlock Ct
- 0 TR38 E Hemlock Ct
- 101 E Hemlock Ln
- 111 E Hemlock Ln
- 81 E Hemlock Ln Unit 24
- 81 E Hemlock Ln
- 651 E Vine Maple Ln
- 671 E Vine Maple Ln
- 131 E Hemlock Ln
- 170 E Hemlock Ln
- 681 E Vine Maple Ln
- 151 E Hemlock Ln
- 999 Vine Maple and Laurel Park
- 999 E Vine Maple Ln
- 51 E Hemlock Ln
- 31 E Hemlock Ln
- 31 E Hemlock Ln
Your Personal Tour Guide
Ask me questions while you tour the home.