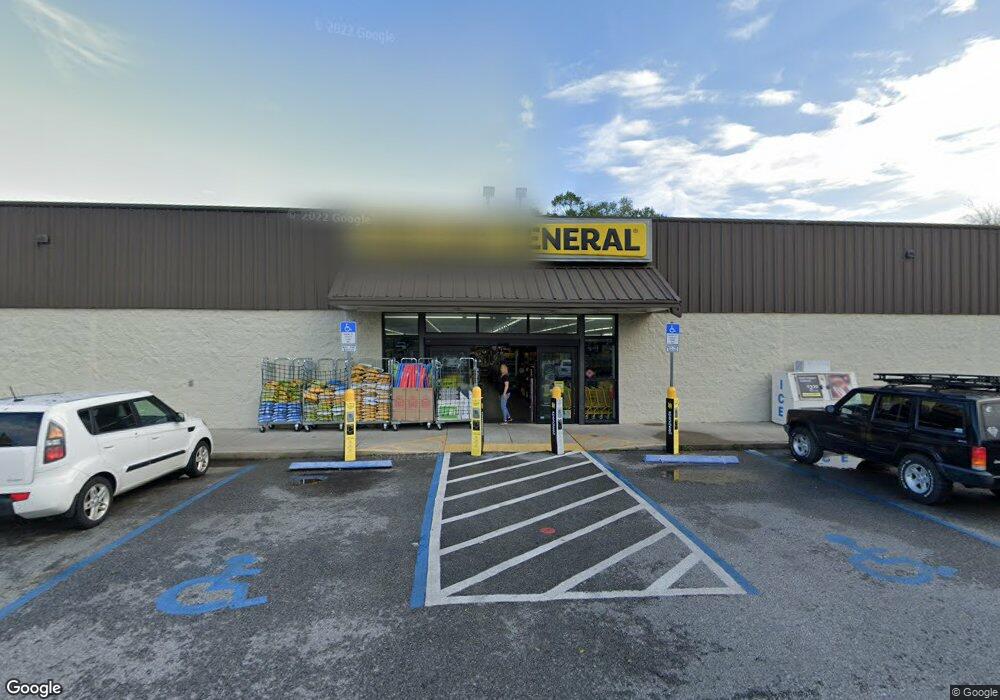
100 E Nine Mile Rd Pensacola, FL 32534
Estimated Value: $2,675,529
--
Bed
1
Bath
2,278
Sq Ft
$1,175/Sq Ft
Est. Value
About This Home
This home is located at 100 E Nine Mile Rd, Pensacola, FL 32534 and is currently estimated at $2,675,529, approximately $1,174 per square foot. 100 E Nine Mile Rd is a home located in Escambia County with nearby schools including L.D. McArthur Elementary School, Ferry Pass Middle School, and J.M. Tate Senior High School.
Ownership History
Date
Name
Owned For
Owner Type
Purchase Details
Closed on
Feb 3, 2021
Sold by
Dg1fl Llc
Bought by
Exchangeright Real Estate Llc
Current Estimated Value
Purchase Details
Closed on
Dec 31, 2015
Sold by
Dg1fl Inc
Bought by
Dg1fl Inc
Purchase Details
Closed on
Jul 26, 2013
Sold by
Teramore Development Llc
Bought by
Dg1fl Inc
Purchase Details
Closed on
Nov 30, 2012
Sold by
Henson Jerrold B and Henson Deborah A
Bought by
Teramore Development Llc
Home Financials for this Owner
Home Financials are based on the most recent Mortgage that was taken out on this home.
Original Mortgage
$1,140,530
Interest Rate
3.4%
Mortgage Type
Commercial
Purchase Details
Closed on
Oct 23, 2000
Sold by
Stephens Francis Pauline and Stephens Edward C
Bought by
Henson Jerrold B and Henson Deborah A
Create a Home Valuation Report for This Property
The Home Valuation Report is an in-depth analysis detailing your home's value as well as a comparison with similar homes in the area
Home Values in the Area
Average Home Value in this Area
Purchase History
| Date | Buyer | Sale Price | Title Company |
|---|---|---|---|
| Exchangeright Real Estate Llc | $2,013,000 | Attorney | |
| Dg1fl Inc | -- | None Available | |
| Dg1fl Inc | $1,763,000 | Attorney | |
| Teramore Development Llc | $475,000 | Citizens Title Group Inc | |
| Henson Jerrold B | $286,000 | -- |
Source: Public Records
Mortgage History
| Date | Status | Borrower | Loan Amount |
|---|---|---|---|
| Previous Owner | Teramore Development Llc | $1,140,530 |
Source: Public Records
Tax History Compared to Growth
Tax History
| Year | Tax Paid | Tax Assessment Tax Assessment Total Assessment is a certain percentage of the fair market value that is determined by local assessors to be the total taxable value of land and additions on the property. | Land | Improvement |
|---|---|---|---|---|
| 2024 | $12,344 | $908,722 | $369,611 | $539,111 |
| 2023 | $12,344 | $898,506 | $369,611 | $528,895 |
| 2022 | $12,212 | $879,702 | $369,611 | $510,091 |
| 2021 | $11,537 | $802,426 | $0 | $0 |
| 2020 | $11,307 | $798,900 | $0 | $0 |
| 2019 | $11,116 | $778,196 | $0 | $0 |
| 2018 | $10,978 | $752,655 | $0 | $0 |
| 2017 | $11,021 | $739,501 | $0 | $0 |
| 2016 | $10,942 | $721,599 | $0 | $0 |
| 2015 | $10,584 | $689,957 | $0 | $0 |
| 2014 | $10,373 | $665,585 | $0 | $0 |
Source: Public Records
Map
Nearby Homes
- 130 E Nine Mile Rd Unit 5-8
- 9024 N Palafox St
- 627 Saleta St
- 9700 Chandler St
- 532 Edith Ln
- 568 Edith Ln
- 576 Edith Ln
- 9901 Monet Way
- 9270 Untreiner Ave
- 10121 Chemstrand Rd
- 9200 Fowler Ave
- 461 Boyette St
- 8916 Chemstrand Rd Unit 19
- 8895 Untreiner Ave
- 111 Sabrina Dr
- 600 W Hannah St
- 8923 Bellawood Cir
- 9901- Raymar St Unit A
- 9901- Raymar St Unit AB
- 607 W Hannah St
- 100 E Nine Mile Rd
- 100 E Nine Mile Rd Unit BLK
- 130 E Nine Mile Rd Unit 17
- 130 E Nine Mile Rd
- 130 E Nine Mile Rd Unit 9
- 130 E Nine Mile Rd Unit 24
- 130 E Nine Mile Rd Unit 2124
- 130 E Nine Mile Rd Unit A,B,C,D
- 130 E Nine Mile Rd Unit Building 3
- 130 E Nine Mile Rd Unit 1
- 130 E Nine Mile Rd Unit Bldg 7. Units 25, 26
- 130 E Nine Mile Rd Unit BLDG 4. UNITS 13, 14
- 130 E Nine Mile Rd Unit 6
- 130 E Nine Mile Rd Unit 22
- 130 E Nine Mile Rd Unit 20
- 130 E Nine Mile Rd
- 130 E Nine Mile Rd Unit 17
- 130 E Nine Mile Rd Unit 27
- 130 E Nine Mile Rd Unit BLDG 4. UNITS 13, 14
- 130 E Nine Mile Rd Unit 1