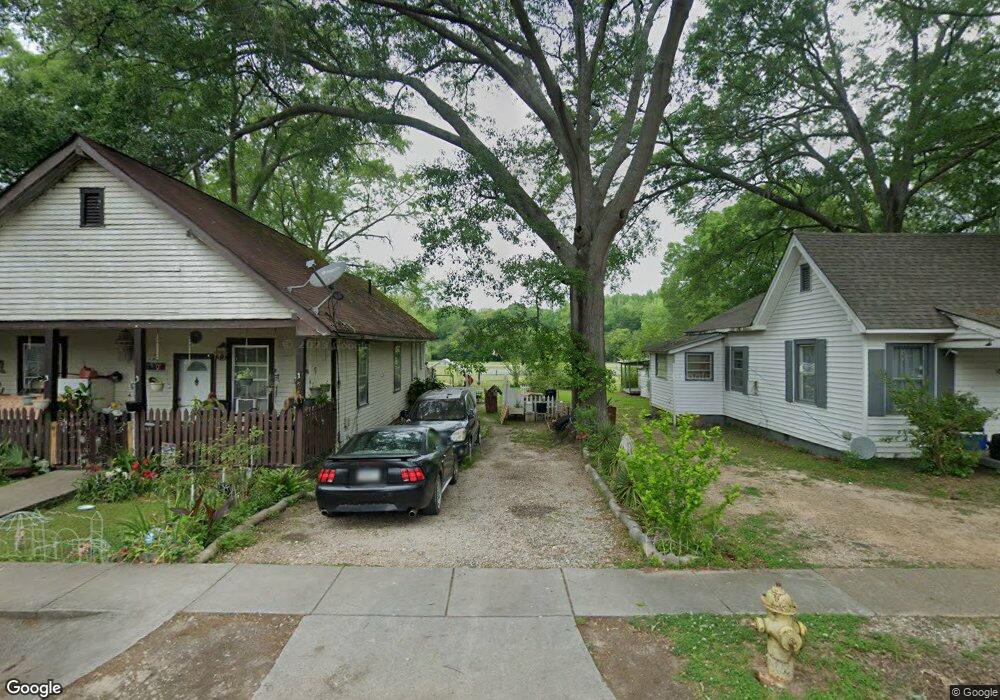
100 Frederick St Hogansville, GA 30230
Estimated Value: $128,251 - $183,000
3
Beds
1
Bath
909
Sq Ft
$158/Sq Ft
Est. Value
About This Home
This home is located at 100 Frederick St, Hogansville, GA 30230 and is currently estimated at $144,063, approximately $158 per square foot. 100 Frederick St is a home located in Troup County with nearby schools including Hogansville Elementary School, Callaway Elementary School, and Callaway Middle School.
Ownership History
Date
Name
Owned For
Owner Type
Purchase Details
Closed on
Feb 28, 2024
Sold by
Mcdowell Robbie C
Bought by
Mcdowell Lisa D and Mcdowell Robbie C
Current Estimated Value
Purchase Details
Closed on
Nov 11, 2002
Sold by
Miller Martin
Bought by
Mcdowell Robbie and Mcdowell Lisa
Purchase Details
Closed on
May 11, 1995
Sold by
John J Ormsby
Bought by
Miller Martin
Purchase Details
Closed on
Mar 1, 1989
Sold by
Johnson Johnson and Johnson Ormsby
Bought by
John J Ormsby
Purchase Details
Closed on
Mar 29, 1988
Sold by
Askew
Bought by
Johnson Johnson and Johnson Ormsby
Purchase Details
Closed on
Mar 1, 1985
Sold by
Kunzer Cynthia Wilkerson
Bought by
Askew
Purchase Details
Closed on
Feb 1, 1985
Sold by
James B Askew
Bought by
Kunzer Cynthia Wilkerson
Purchase Details
Closed on
Jan 1, 1972
Sold by
Trustee Of John Wilkinson
Bought by
James B Askew
Purchase Details
Closed on
Jan 1, 1960
Sold by
Denney L E
Bought by
Trustee Of John Wilkinson
Create a Home Valuation Report for This Property
The Home Valuation Report is an in-depth analysis detailing your home's value as well as a comparison with similar homes in the area
Home Values in the Area
Average Home Value in this Area
Purchase History
| Date | Buyer | Sale Price | Title Company |
|---|---|---|---|
| Mcdowell Lisa D | -- | -- | |
| Mcdowell Robbie | $18,800 | -- | |
| Miller Martin | -- | -- | |
| John J Ormsby | -- | -- | |
| Johnson Johnson | $13,500 | -- | |
| Askew | -- | -- | |
| Kunzer Cynthia Wilkerson | -- | -- | |
| James B Askew | -- | -- | |
| Trustee Of John Wilkinson | -- | -- |
Source: Public Records
Tax History Compared to Growth
Tax History
| Year | Tax Paid | Tax Assessment Tax Assessment Total Assessment is a certain percentage of the fair market value that is determined by local assessors to be the total taxable value of land and additions on the property. | Land | Improvement |
|---|---|---|---|---|
| 2024 | $714 | $21,800 | $8,000 | $13,800 |
| 2023 | $70 | $21,440 | $8,000 | $13,440 |
| 2022 | $498 | $15,440 | $4,000 | $11,440 |
| 2021 | $301 | $9,480 | $1,920 | $7,560 |
| 2020 | $301 | $9,480 | $1,920 | $7,560 |
| 2019 | $294 | $9,280 | $1,920 | $7,360 |
| 2018 | $262 | $8,460 | $1,980 | $6,480 |
| 2017 | $262 | $8,460 | $1,980 | $6,480 |
| 2016 | $283 | $9,008 | $1,980 | $7,028 |
| 2015 | $297 | $8,976 | $1,948 | $7,028 |
| 2014 | $160 | $5,746 | $1,644 | $4,102 |
| 2013 | -- | $6,312 | $1,644 | $4,668 |
Source: Public Records
Map
Nearby Homes
- 100 International St
- 407 Green Ave
- 400 Lawrence St
- 606 Green Ave
- 404 Lincoln St
- 203 White Ave
- 208 Royal Ave
- 205 White St
- 214 Collier St
- 215 Johnson St
- 213 Johnson St
- 117 Duck Walk Way
- 209 Duck Walk Way
- 0 Blue Cr Rd Unit 21222703
- 402 Power Plant Rd
- 0 Georgia 100 Unit 10591508
- 613 Rifle Ridge
- 617 Rifle Ridge
- 619 Rifle Ridge
- 608 Rifle Ridge
- 102 Frederick St
- 101 Frederick St
- 104 Frederick St
- 200 Dickinson St
- 202 Dickinson St
- 103 Frederick St
- 104 Dickinson St Unit 7
- 204 Dickinson St
- 106 Frederick St
- 206 Dickinson St
- 105 Frederick St
- 100 Dickinson St
- 403 Green Ave
- 208 Dickinson St
- 108 Frederick St
- 500 Askew Ave
- 105 International St
- 107 International St
- 103 International St
- 405 Green Ave