Estimated Value: $170,565 - $241,000
9
Beds
5
Baths
2,618
Sq Ft
$77/Sq Ft
Est. Value
About This Home
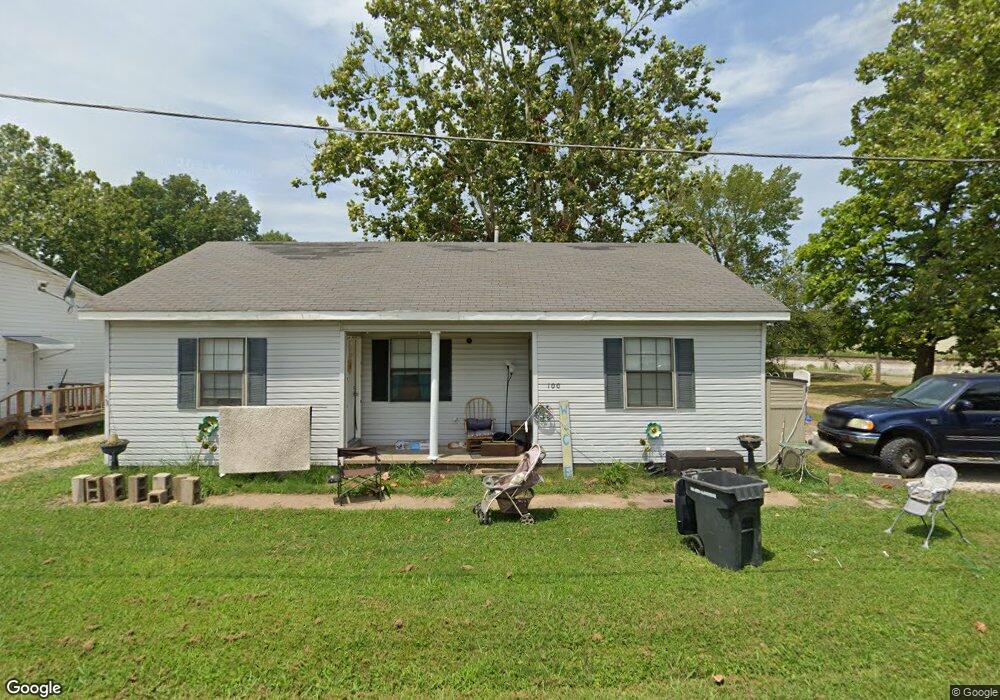
This home is located at 100 Gillihan St Unit 208 A, 208 B, 208 C, Bono, AR 72416 and is currently estimated at $202,641, approximately $77 per square foot. 100 Gillihan St Unit 208 A, 208 B, 208 C is a home located in Craighead County with nearby schools including Westside Elementary School, Westside Middle School, and Westside High School.
Ownership History
Date
Name
Owned For
Owner Type
Purchase Details
Closed on
Jul 8, 2015
Bought by
Gwb Rentals Llc
Current Estimated Value
Home Financials for this Owner
Home Financials are based on the most recent Mortgage that was taken out on this home.
Original Mortgage
$100,000
Outstanding Balance
$78,110
Interest Rate
3.91%
Mortgage Type
New Conventional
Estimated Equity
$124,531
Purchase Details
Closed on
Jul 7, 2015
Sold by
Jake Barnes Rentals Bono Inc
Bought by
Gwb Rentals Llc
Home Financials for this Owner
Home Financials are based on the most recent Mortgage that was taken out on this home.
Original Mortgage
$100,000
Outstanding Balance
$78,110
Interest Rate
3.91%
Mortgage Type
New Conventional
Estimated Equity
$124,531
Purchase Details
Closed on
Jun 3, 2015
Bought by
Jake Barnes Rentals/Bono Inc
Home Financials for this Owner
Home Financials are based on the most recent Mortgage that was taken out on this home.
Original Mortgage
$100,000
Outstanding Balance
$78,110
Interest Rate
3.91%
Mortgage Type
New Conventional
Estimated Equity
$124,531
Purchase Details
Closed on
Jul 1, 1997
Bought by
Barnes Inc
Create a Home Valuation Report for This Property
The Home Valuation Report is an in-depth analysis detailing your home's value as well as a comparison with similar homes in the area
Home Values in the Area
Average Home Value in this Area
Purchase History
| Date | Buyer | Sale Price | Title Company |
|---|---|---|---|
| Gwb Rentals Llc | $145,000 | -- | |
| Gwb Rentals Llc | $145,000 | Lenders Title Company | |
| Jake Barnes Rentals/Bono Inc | -- | -- | |
| Barnes Inc | -- | -- |
Source: Public Records
Mortgage History
| Date | Status | Borrower | Loan Amount |
|---|---|---|---|
| Open | Gwb Rentals Llc | $100,000 |
Source: Public Records
Tax History Compared to Growth
Tax History
| Year | Tax Paid | Tax Assessment Tax Assessment Total Assessment is a certain percentage of the fair market value that is determined by local assessors to be the total taxable value of land and additions on the property. | Land | Improvement |
|---|---|---|---|---|
| 2025 | $1,364 | $31,224 | $1,000 | $30,224 |
| 2024 | $1,364 | $31,224 | $1,000 | $30,224 |
| 2023 | $1,229 | $32,063 | $1,000 | $31,063 |
| 2022 | $1,127 | $32,063 | $1,000 | $31,063 |
| 2021 | $1,050 | $22,880 | $1,000 | $21,880 |
| 2020 | $1,048 | $22,880 | $1,000 | $21,880 |
| 2019 | $1,048 | $22,880 | $1,000 | $21,880 |
| 2018 | $1,048 | $22,880 | $1,000 | $21,880 |
| 2017 | $1,048 | $22,880 | $1,000 | $21,880 |
| 2016 | $1,096 | $23,930 | $2,000 | $21,930 |
| 2015 | $1,096 | $22,220 | $2,000 | $20,220 |
| 2014 | $5 | $20,510 | $2,000 | $18,510 |
Source: Public Records
Map
Nearby Homes
- 100 Gillihan St Unit 208 HWY 63
- 101 W College St
- 206 Highway 63 N
- 300 Highway 63 N
- 305 Spicer
- 303 Highway 63 N
- 309A Hwy 63
- 108 Frisco St
- 200 Church St
- 2.93 acres Cr 376
- 3 Acres Cr 379
- 0 Cr 105
- 0 Cr 323 Unit 16007664
- Lot 5 W College St
- 207 Church St
- 304 W College St
- 301 W College St
- 309 Highway 63 N
- 309 Highway 63 N Unit 309, 309 B Hwy 63
- 309 Highway 63 N Unit 309 A & B HWY 63