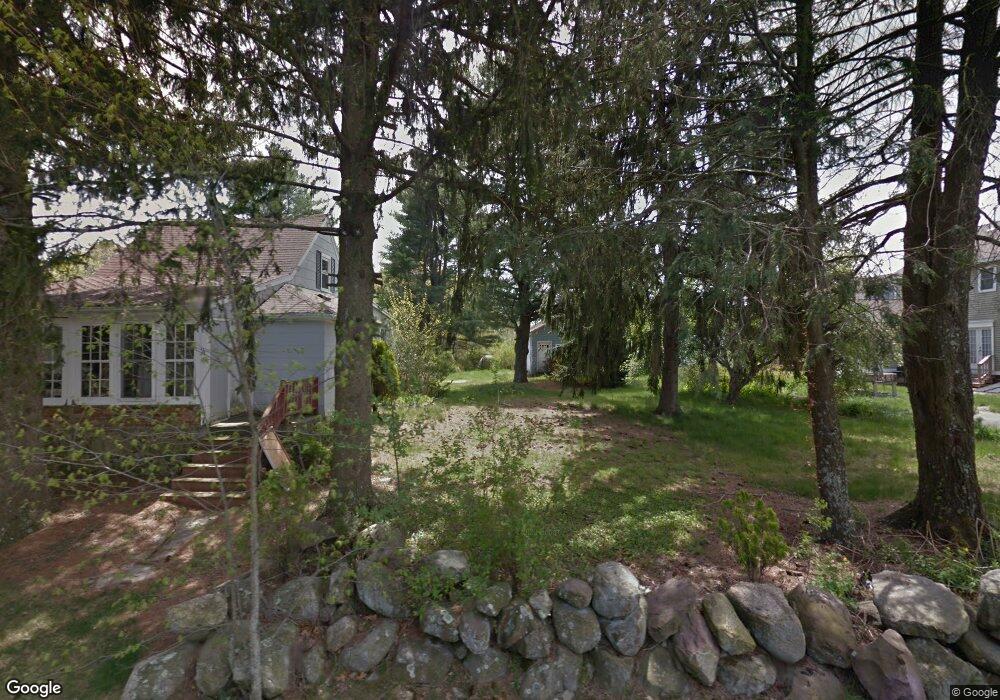
100 Gold St Randolph, MA 02368
North Randolph NeighborhoodEstimated Value: $898,000 - $1,114,000
4
Beds
4
Baths
3,276
Sq Ft
$300/Sq Ft
Est. Value
About This Home
This home is located at 100 Gold St, Randolph, MA 02368 and is currently estimated at $981,653, approximately $299 per square foot. 100 Gold St is a home with nearby schools including Randolph High School and Lighthouse Baptist Christian Academy.
Ownership History
Date
Name
Owned For
Owner Type
Purchase Details
Closed on
Jul 21, 2017
Sold by
Colson Lawrence M and Colson Kathleen K
Bought by
Mukasa Henry M and Mukasa Mildred M
Current Estimated Value
Home Financials for this Owner
Home Financials are based on the most recent Mortgage that was taken out on this home.
Original Mortgage
$200,000
Outstanding Balance
$105,583
Interest Rate
3.89%
Mortgage Type
New Conventional
Estimated Equity
$876,070
Create a Home Valuation Report for This Property
The Home Valuation Report is an in-depth analysis detailing your home's value as well as a comparison with similar homes in the area
Home Values in the Area
Average Home Value in this Area
Purchase History
| Date | Buyer | Sale Price | Title Company |
|---|---|---|---|
| Mukasa Henry M | $568,000 | -- |
Source: Public Records
Mortgage History
| Date | Status | Borrower | Loan Amount |
|---|---|---|---|
| Open | Mukasa Henry M | $200,000 |
Source: Public Records
Tax History Compared to Growth
Tax History
| Year | Tax Paid | Tax Assessment Tax Assessment Total Assessment is a certain percentage of the fair market value that is determined by local assessors to be the total taxable value of land and additions on the property. | Land | Improvement |
|---|---|---|---|---|
| 2025 | $10,159 | $875,000 | $255,400 | $619,600 |
| 2024 | $9,751 | $851,600 | $250,400 | $601,200 |
| 2023 | $9,711 | $803,900 | $227,700 | $576,200 |
| 2022 | $8,995 | $661,400 | $189,900 | $471,500 |
| 2021 | $8,970 | $606,900 | $158,200 | $448,700 |
| 2020 | $8,770 | $588,200 | $158,200 | $430,000 |
| 2019 | $8,359 | $558,000 | $150,600 | $407,400 |
| 2018 | $8,616 | $542,600 | $124,500 | $418,100 |
| 2017 | $1,917 | $118,500 | $118,500 | $0 |
| 2016 | $3,162 | $181,800 | $107,800 | $74,000 |
| 2015 | $1,857 | $102,600 | $102,600 | $0 |
Source: Public Records
Map
Nearby Homes
- 79 Gold St
- 43 Emily Jeffers Rd
- 33 Michael Rd
- 2 Smith Rd
- 902 Irving Rd Unit 902
- 232 Canton St Unit 104
- 10 Michael Rd
- 3 Eagle Rock Rd
- 51 Himoor Cir
- 20 Simmonds Blvd Unit 20
- 18 Simmonds Blvd Unit 18
- 8 Simmonds Blvd Unit 8
- 22 Simmonds Blvd Unit 22
- 10 Simmonds Blvd Unit 10
- 24 Simmonds Blvd Unit 24
- 14 Simmonds Blvd Unit 14
- 6 Simmonds Blvd Unit 6
- 12 Simmonds Blvd Unit 12
- 304 High St
- 6 Sunset Dr