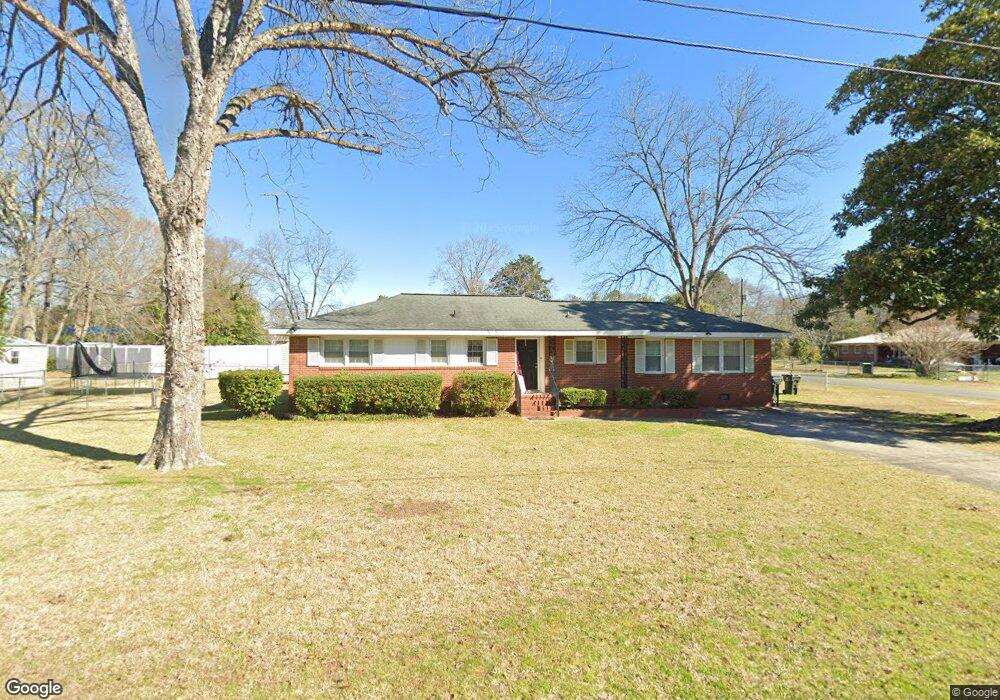
100 Gordon St Warner Robins, GA 31093
Estimated Value: $142,339 - $159,000
3
Beds
2
Baths
1,560
Sq Ft
$96/Sq Ft
Est. Value
About This Home
This home is located at 100 Gordon St, Warner Robins, GA 31093 and is currently estimated at $150,085, approximately $96 per square foot. 100 Gordon St is a home located in Houston County with nearby schools including Parkwood Elementary School, Northside Middle School, and Northside High School.
Ownership History
Date
Name
Owned For
Owner Type
Purchase Details
Closed on
Mar 21, 2008
Sold by
Harris Kimberly S
Bought by
Cross Hugh A and Cross Alecia M
Current Estimated Value
Purchase Details
Closed on
Apr 18, 1986
Bought by
Smith Rabun O
Create a Home Valuation Report for This Property
The Home Valuation Report is an in-depth analysis detailing your home's value as well as a comparison with similar homes in the area
Home Values in the Area
Average Home Value in this Area
Purchase History
| Date | Buyer | Sale Price | Title Company |
|---|---|---|---|
| Cross Hugh A | $45,000 | None Available | |
| Smith Rabun O | $49,100 | -- |
Source: Public Records
Tax History Compared to Growth
Tax History
| Year | Tax Paid | Tax Assessment Tax Assessment Total Assessment is a certain percentage of the fair market value that is determined by local assessors to be the total taxable value of land and additions on the property. | Land | Improvement |
|---|---|---|---|---|
| 2024 | $1,432 | $43,772 | $4,800 | $38,972 |
| 2023 | $1,265 | $38,372 | $4,800 | $33,572 |
| 2022 | $785 | $34,132 | $4,800 | $29,332 |
| 2021 | $682 | $29,512 | $4,800 | $24,712 |
| 2020 | $684 | $29,432 | $4,800 | $24,632 |
| 2019 | $684 | $29,432 | $4,800 | $24,632 |
| 2018 | $684 | $29,432 | $4,800 | $24,632 |
| 2017 | $684 | $29,432 | $4,800 | $24,632 |
| 2016 | $685 | $29,432 | $4,800 | $24,632 |
| 2015 | -- | $29,960 | $4,800 | $25,160 |
| 2014 | -- | $29,960 | $4,800 | $25,160 |
| 2013 | -- | $29,960 | $4,800 | $25,160 |
Source: Public Records
Map
Nearby Homes
- 125 Anne Dr
- 113 Pearce Dr
- 105 Briardale Ave
- 122 Jay Dr
- 110 Briardale Ave
- 112 Briardale Ave
- 402 & 404 Green St
- 99 Green St Unit 101 Green Street
- 127 Edna Place
- 94 Ravenwood Way
- 133 Briardale Ave
- 117 Forest Park Dr
- 100 Ravenwood Way
- 311 Arnold Blvd
- 212 Arnold Blvd
- 113 Vernon Dr
- 206 Sunstede Rd
- 423 Alabama Ave
- 214 Kingsbury Cir
- 500 Northside Dr