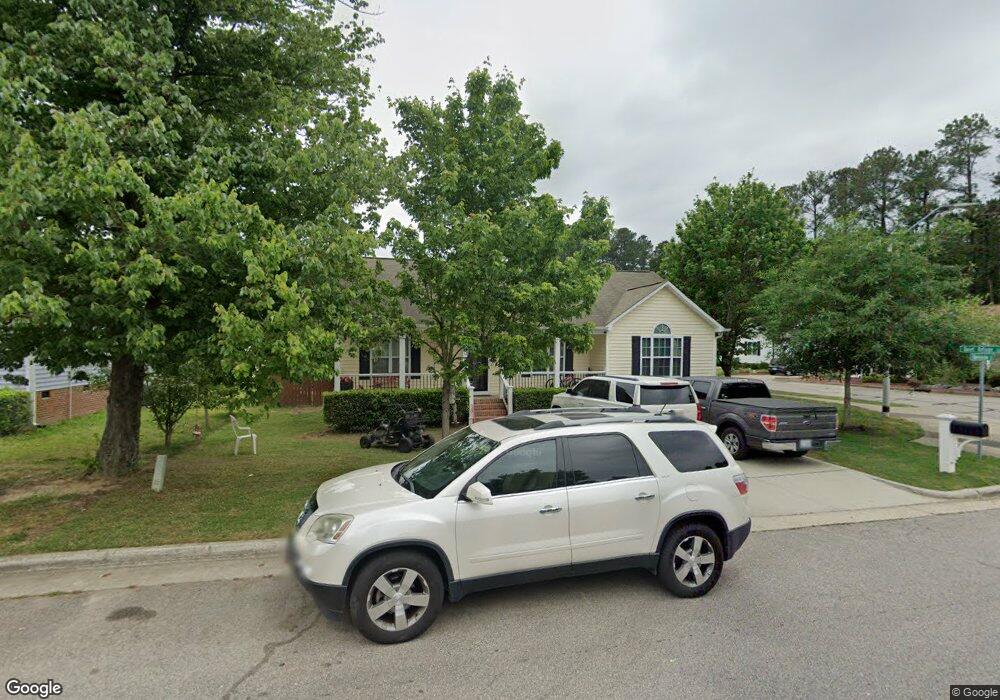
100 Havenview Ct Garner, NC 27529
Estimated Value: $291,000 - $350,000
3
Beds
2
Baths
1,361
Sq Ft
$234/Sq Ft
Est. Value
About This Home
This home is located at 100 Havenview Ct, Garner, NC 27529 and is currently estimated at $318,489, approximately $234 per square foot. 100 Havenview Ct is a home located in Wake County with nearby schools including Creech Road Elementary School, North Garner Middle, and Garner High.
Ownership History
Date
Name
Owned For
Owner Type
Purchase Details
Closed on
Oct 15, 2014
Sold by
Gold Leaf Properties Llc
Bought by
Garcia-Azanza Vicente and Maravilla Griselda Barrientos
Current Estimated Value
Home Financials for this Owner
Home Financials are based on the most recent Mortgage that was taken out on this home.
Original Mortgage
$108,000
Outstanding Balance
$60,151
Interest Rate
4.16%
Mortgage Type
New Conventional
Estimated Equity
$258,338
Purchase Details
Closed on
Jun 24, 2008
Sold by
Comfort Homes Inc
Bought by
Gold Leaf Properties Llc
Home Financials for this Owner
Home Financials are based on the most recent Mortgage that was taken out on this home.
Original Mortgage
$81,500
Interest Rate
5.97%
Mortgage Type
Purchase Money Mortgage
Purchase Details
Closed on
Oct 13, 2006
Sold by
Weston Ridge Associates Llc
Bought by
Comfort Homes Inc
Create a Home Valuation Report for This Property
The Home Valuation Report is an in-depth analysis detailing your home's value as well as a comparison with similar homes in the area
Home Values in the Area
Average Home Value in this Area
Purchase History
| Date | Buyer | Sale Price | Title Company |
|---|---|---|---|
| Garcia-Azanza Vicente | $123,000 | None Available | |
| Gold Leaf Properties Llc | $104,500 | None Available | |
| Comfort Homes Inc | $217,000 | None Available |
Source: Public Records
Mortgage History
| Date | Status | Borrower | Loan Amount |
|---|---|---|---|
| Open | Garcia-Azanza Vicente | $108,000 | |
| Previous Owner | Gold Leaf Properties Llc | $81,500 |
Source: Public Records
Tax History
| Year | Tax Paid | Tax Assessment Tax Assessment Total Assessment is a certain percentage of the fair market value that is determined by local assessors to be the total taxable value of land and additions on the property. | Land | Improvement |
|---|---|---|---|---|
| 2025 | $3,519 | $337,399 | $120,000 | $217,399 |
| 2024 | $3,507 | $337,399 | $120,000 | $217,399 |
Source: Public Records
Map
Nearby Homes
- 500 Oak Reserve Rd Unit 103
- 500 Oak Reserve Rd Unit 102
- 500 Oak Reserve Rd Unit 100
- 1320 W Garner Rd Unit 100
- 1320 W Garner Rd Unit 103
- 1320 W Garner Rd Unit 101
- 1320 W Garner Rd Unit 102
- 1320 W Garner Rd
- 209 Weston Rd
- 104 Westonridge Run
- 3904 Cobb St
- 420 Johnson St
- 801 Powell Dr
- 113 Johnson St
- 1600 Cranston Rd
- 130 Muirfield Ridge Dr
- 406 Avery St
- 500 Oak Reserve Dr Unit 103
- 500 Oak Reserve Dr Unit 102
- 500 Oak Reserve Dr Unit 100
- 104 Quiet Refuge Ln
- 104 Havenview Ct
- 132 Grassy Rio Ln
- 128 Grassy Rio Ln
- 105 Quiet Refuge Ln
- 112 Quiet Refuge Ln
- 109 Quiet Refuge Ln
- 108 Havenview Ct
- 105 Havenview Ct
- 101 Quiet Refuge Ln
- 124 Grassy Rio Ln
- 113 Quiet Refuge Ln
- 109 Havenview Ct
- 140 Gentle Rio Ct
- 116 Quiet Refuge Ln
- 112 Havenview Ct
- 129 Grassy Rio Ln
- 137 Grassy Rio Ln
- 120 Grassy Rio Ln
- 132 Gentle Rio Ct
Your Personal Tour Guide
Ask me questions while you tour the home.