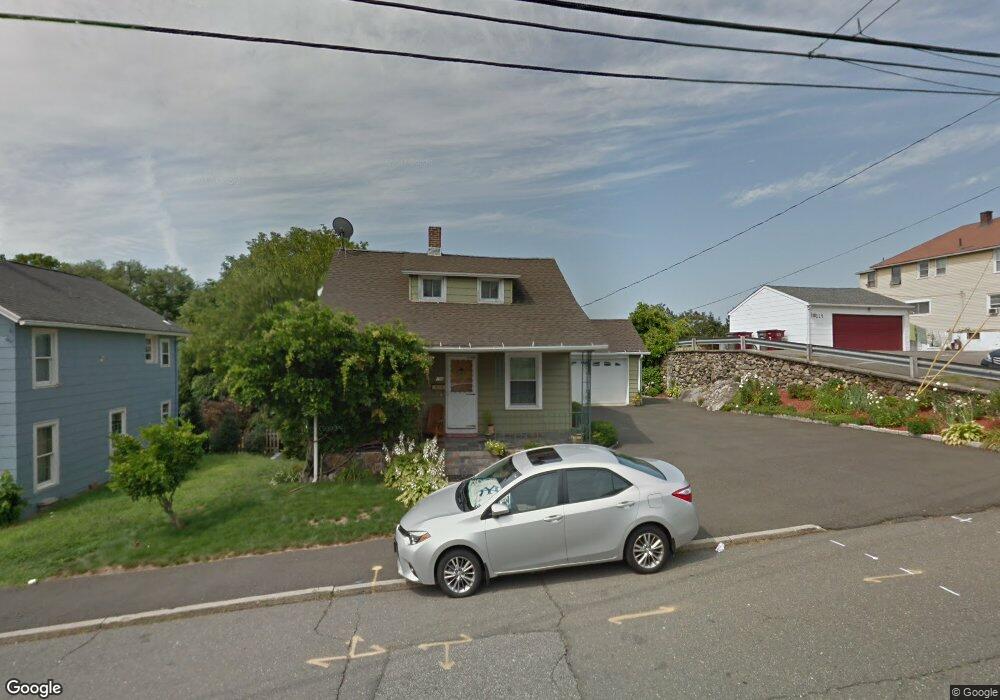
100 High St Naugatuck, CT 06770
Estimated Value: $300,000 - $349,000
3
Beds
2
Baths
1,260
Sq Ft
$255/Sq Ft
Est. Value
About This Home
This home is located at 100 High St, Naugatuck, CT 06770 and is currently estimated at $321,499, approximately $255 per square foot. 100 High St is a home located in New Haven County with nearby schools including City Hill Middle School and Naugatuck High School.
Ownership History
Date
Name
Owned For
Owner Type
Purchase Details
Closed on
Nov 30, 2020
Sold by
Chaves Carl R and Chaves Jose E
Bought by
Macas Robertrh A
Current Estimated Value
Home Financials for this Owner
Home Financials are based on the most recent Mortgage that was taken out on this home.
Original Mortgage
$165,600
Outstanding Balance
$147,696
Interest Rate
2.8%
Mortgage Type
New Conventional
Estimated Equity
$173,803
Purchase Details
Closed on
Jul 1, 1997
Sold by
Carnaroli Michael and Owens Cynthia
Bought by
Chaves Jose and Chaves Carla
Home Financials for this Owner
Home Financials are based on the most recent Mortgage that was taken out on this home.
Original Mortgage
$66,300
Interest Rate
7.35%
Mortgage Type
Purchase Money Mortgage
Create a Home Valuation Report for This Property
The Home Valuation Report is an in-depth analysis detailing your home's value as well as a comparison with similar homes in the area
Home Values in the Area
Average Home Value in this Area
Purchase History
| Date | Buyer | Sale Price | Title Company |
|---|---|---|---|
| Macas Robertrh A | $207,000 | None Available | |
| Chaves Jose | $75,000 | -- |
Source: Public Records
Mortgage History
| Date | Status | Borrower | Loan Amount |
|---|---|---|---|
| Open | Macas Robertrh A | $165,600 | |
| Previous Owner | Chaves Jose | $66,300 |
Source: Public Records
Tax History
| Year | Tax Paid | Tax Assessment Tax Assessment Total Assessment is a certain percentage of the fair market value that is determined by local assessors to be the total taxable value of land and additions on the property. | Land | Improvement |
|---|---|---|---|---|
| 2025 | $6,292 | $158,130 | $28,840 | $129,290 |
| 2024 | $6,608 | $158,130 | $28,840 | $129,290 |
| 2023 | $7,076 | $158,130 | $28,840 | $129,290 |
| 2022 | $5,323 | $111,470 | $31,100 | $80,370 |
| 2021 | $5,323 | $111,470 | $31,100 | $80,370 |
| 2020 | $5,323 | $111,470 | $31,100 | $80,370 |
| 2019 | $5,267 | $111,470 | $31,100 | $80,370 |
| 2018 | $4,693 | $97,060 | $37,420 | $59,640 |
| 2017 | $4,712 | $97,060 | $37,420 | $59,640 |
| 2016 | $4,627 | $97,060 | $37,420 | $59,640 |
| 2015 | $4,423 | $97,060 | $37,420 | $59,640 |
| 2014 | $4,374 | $97,060 | $37,420 | $59,640 |
| 2012 | $4,916 | $146,530 | $47,250 | $99,280 |
Source: Public Records
Map
Nearby Homes
- 53 High St
- 80 Ward St
- 79 Ward St
- 3 Maple Terrace
- 22 Lewis St
- 80 Olive St
- 150 Scott St
- 121 Johnson St
- 37 Ann St
- 80 Cliff St
- 137 Lincoln St
- 130 Celentano Dr
- 41 Millville Ave Unit 201
- 46 Mulberry St
- 128 Millville Ave
- 848 New Haven Rd
- 231 N Main St
- 856 New Haven Rd
- 150 Millville Ave
- 0 Andrew Mountain Rd Unit 170603648
Your Personal Tour Guide
Ask me questions while you tour the home.