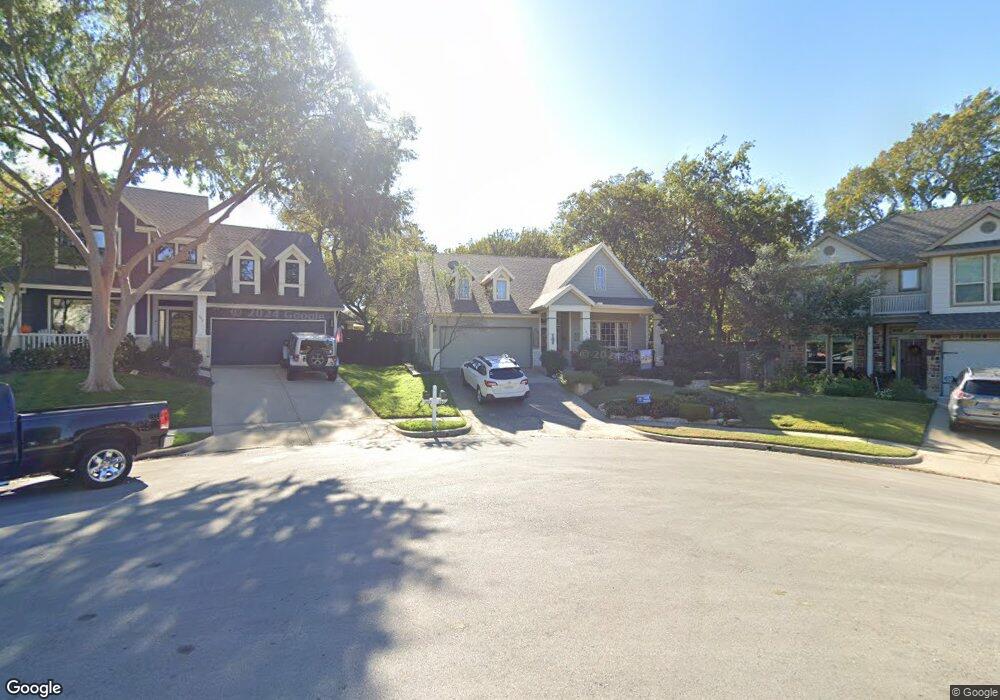
100 Ivy Glen Dr Grapevine, TX 76051
Estimated Value: $597,000 - $650,000
3
Beds
2
Baths
2,227
Sq Ft
$275/Sq Ft
Est. Value
About This Home
This home is located at 100 Ivy Glen Dr, Grapevine, TX 76051 and is currently estimated at $611,866, approximately $274 per square foot. 100 Ivy Glen Dr is a home located in Tarrant County with nearby schools including Silver Lake Elementary School, Grapevine Middle, and Vine Academy.
Ownership History
Date
Name
Owned For
Owner Type
Purchase Details
Closed on
Oct 4, 2011
Sold by
Lazarus Construction Inc
Bought by
Stock Loan Services Llc
Current Estimated Value
Purchase Details
Closed on
Oct 31, 2007
Sold by
Lazarus Leasing Inc
Bought by
Lazarus Construction Inc
Home Financials for this Owner
Home Financials are based on the most recent Mortgage that was taken out on this home.
Original Mortgage
$119,800
Interest Rate
6.4%
Mortgage Type
Construction
Purchase Details
Closed on
May 2, 2005
Sold by
Waters Richard C
Bought by
Rowntree Suzanne
Purchase Details
Closed on
Jul 30, 2002
Sold by
Floren Frederick
Bought by
Weekley Homes Lp
Purchase Details
Closed on
Oct 27, 2000
Sold by
Weekley Homes Lp
Bought by
Waters Richard C
Home Financials for this Owner
Home Financials are based on the most recent Mortgage that was taken out on this home.
Original Mortgage
$150,000
Interest Rate
7.87%
Create a Home Valuation Report for This Property
The Home Valuation Report is an in-depth analysis detailing your home's value as well as a comparison with similar homes in the area
Home Values in the Area
Average Home Value in this Area
Purchase History
| Date | Buyer | Sale Price | Title Company |
|---|---|---|---|
| Stock Loan Services Llc | $75,000 | None Available | |
| Lazarus Construction Inc | -- | None Available | |
| Rowntree Suzanne | -- | American Title | |
| Weekley Homes Lp | -- | Stewart Title | |
| Waters Richard C | -- | Stewart Title |
Source: Public Records
Mortgage History
| Date | Status | Borrower | Loan Amount |
|---|---|---|---|
| Previous Owner | Lazarus Construction Inc | $119,800 | |
| Previous Owner | Waters Richard C | $150,000 |
Source: Public Records
Tax History Compared to Growth
Tax History
| Year | Tax Paid | Tax Assessment Tax Assessment Total Assessment is a certain percentage of the fair market value that is determined by local assessors to be the total taxable value of land and additions on the property. | Land | Improvement |
|---|---|---|---|---|
| 2025 | $1,706 | $608,988 | $126,500 | $482,488 |
| 2024 | $1,706 | $608,988 | $126,500 | $482,488 |
| 2023 | $8,496 | $584,984 | $115,000 | $469,984 |
| 2022 | $9,128 | $482,847 | $74,750 | $408,097 |
| 2021 | $9,107 | $418,842 | $74,750 | $344,092 |
| 2020 | $8,421 | $382,829 | $74,750 | $308,079 |
| 2019 | $8,729 | $382,785 | $74,750 | $308,035 |
| 2018 | $1,676 | $358,760 | $74,750 | $284,010 |
| 2017 | $7,711 | $344,907 | $74,750 | $270,157 |
| 2016 | $7,010 | $303,140 | $74,750 | $228,390 |
| 2015 | $5,167 | $287,700 | $46,000 | $241,700 |
| 2014 | $5,167 | $287,700 | $46,000 | $241,700 |
Source: Public Records
Map
Nearby Homes
- 309 N Main St
- 218 W Peach St
- 124 Sycamore Ct
- 504 Landing Ct
- 800 Spring Creek Dr
- 460 Caviness Dr
- 404 E Wall St
- 509 Estill St
- 525 Estill St
- 210 Austin St
- 1002 Meadow Bend Loop N
- 841 Meadow Bend Loop W
- 422 Smith St
- 424 E Worth St Unit 422-24
- 223 Wood St Unit 201
- 723 E Worth St
- 717 E Worth St
- 1201 Circle View Ct
- 826 E Texas St
- 620 W College St
- 102 Ivy Glen Dr
- 501 Hawthorne St
- 503 Hawthorne St
- 104 Ivy Glen Dr
- 511 N Main St
- 505 Hawthorne St
- 106 Ivy Glen Dr
- 500 Hawthorne St
- 101 Wildwood Ct
- 101 Wildwood Ct Unit A
- 101 Wildwood Ct Unit C
- 101 Wildwood Ct Unit B
- 108 Ivy Glen Dr
- 415 N Main St
- 421 Brewer St
- 507 Hawthorne St
- 502 Hawthorne St
- 414 N Main St
- 119 W Hall St
- 112 W Peach St