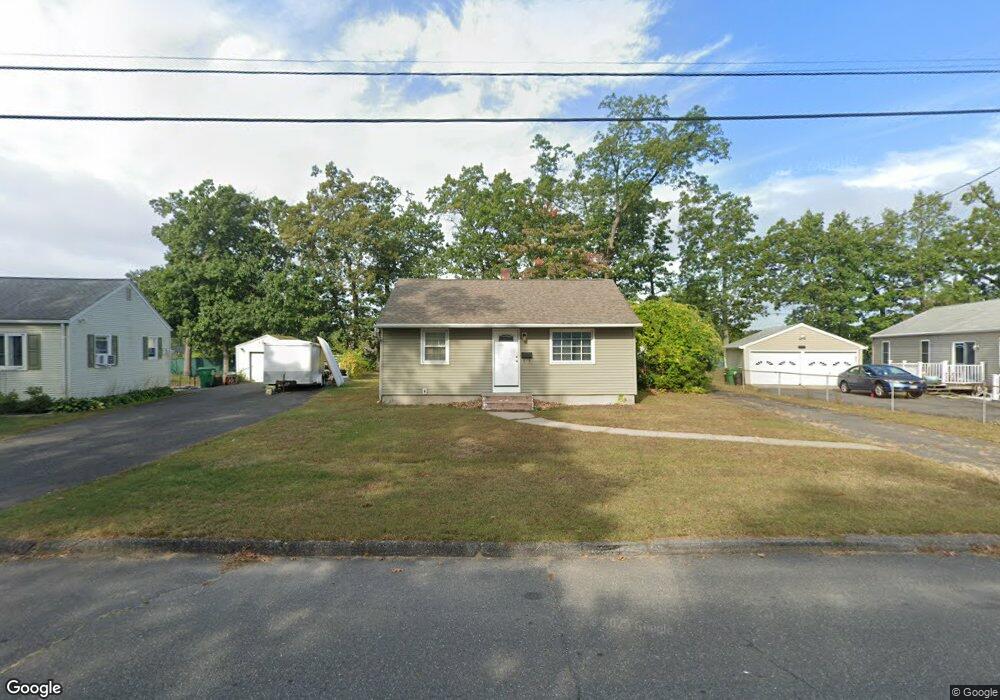
100 Keddy Blvd Chicopee, MA 01020
Fairview NeighborhoodEstimated Value: $221,000 - $285,000
2
Beds
1
Bath
720
Sq Ft
$359/Sq Ft
Est. Value
About This Home
This home is located at 100 Keddy Blvd, Chicopee, MA 01020 and is currently estimated at $258,406, approximately $358 per square foot. 100 Keddy Blvd is a home located in Hampden County with nearby schools including Bowie Elementary School, Fairview Middle School, and Chicopee Comprehensive High School.
Ownership History
Date
Name
Owned For
Owner Type
Purchase Details
Closed on
Mar 22, 2011
Sold by
Labrie David C
Bought by
Kurzeski Joseph T
Current Estimated Value
Home Financials for this Owner
Home Financials are based on the most recent Mortgage that was taken out on this home.
Original Mortgage
$111,650
Outstanding Balance
$76,895
Interest Rate
4.84%
Mortgage Type
Purchase Money Mortgage
Estimated Equity
$181,511
Purchase Details
Closed on
Nov 10, 2010
Sold by
Miesch George J
Bought by
Labrie David C
Create a Home Valuation Report for This Property
The Home Valuation Report is an in-depth analysis detailing your home's value as well as a comparison with similar homes in the area
Home Values in the Area
Average Home Value in this Area
Purchase History
| Date | Buyer | Sale Price | Title Company |
|---|---|---|---|
| Kurzeski Joseph T | $145,000 | -- | |
| Labrie David C | $62,500 | -- |
Source: Public Records
Mortgage History
| Date | Status | Borrower | Loan Amount |
|---|---|---|---|
| Open | Kurzeski Joseph T | $111,650 |
Source: Public Records
Tax History
| Year | Tax Paid | Tax Assessment Tax Assessment Total Assessment is a certain percentage of the fair market value that is determined by local assessors to be the total taxable value of land and additions on the property. | Land | Improvement |
|---|---|---|---|---|
| 2025 | $2,785 | $183,700 | $107,100 | $76,600 |
| 2024 | $2,682 | $181,700 | $105,000 | $76,700 |
| 2023 | $2,491 | $164,400 | $95,400 | $69,000 |
| 2022 | $2,390 | $140,700 | $83,000 | $57,700 |
| 2021 | $2,289 | $130,000 | $75,400 | $54,600 |
| 2020 | $2,242 | $128,400 | $77,500 | $50,900 |
| 2019 | $2,240 | $124,700 | $77,500 | $47,200 |
| 2018 | $2,183 | $119,200 | $73,800 | $45,400 |
| 2017 | $2,079 | $120,100 | $68,300 | $51,800 |
| 2016 | $1,962 | $116,000 | $68,300 | $47,700 |
| 2015 | $2,156 | $122,900 | $68,300 | $54,600 |
| 2014 | $1,078 | $122,900 | $68,300 | $54,600 |
Source: Public Records
Map
Nearby Homes
- 81 Mccarthy Ave
- 39 Mccarthy Ave
- 523 James St
- 180 Fletcher Cir
- 134 Lukasik St
- 104 Johnson Rd Unit 1103
- 104 Johnson Rd Unit 707
- 143 Royal St
- 15 Hudson Ave
- 83 Old Farm Rd
- 90 Anson St
- 18 Devlin Dr
- 210 Johnson Rd Unit 23
- 341 Montcalm St
- 37 Greenwood Terrace
- 70 Greenwood Terrace
- 128 Ann St
- 119 Oakridge St
- 442 Prospect St
- 52 Falmouth Rd
Your Personal Tour Guide
Ask me questions while you tour the home.