
Seller's Agent in 2025
Nicola Francis
Lenox Realty Group
(617) 447-9312
1 in this area
10 Total Sales
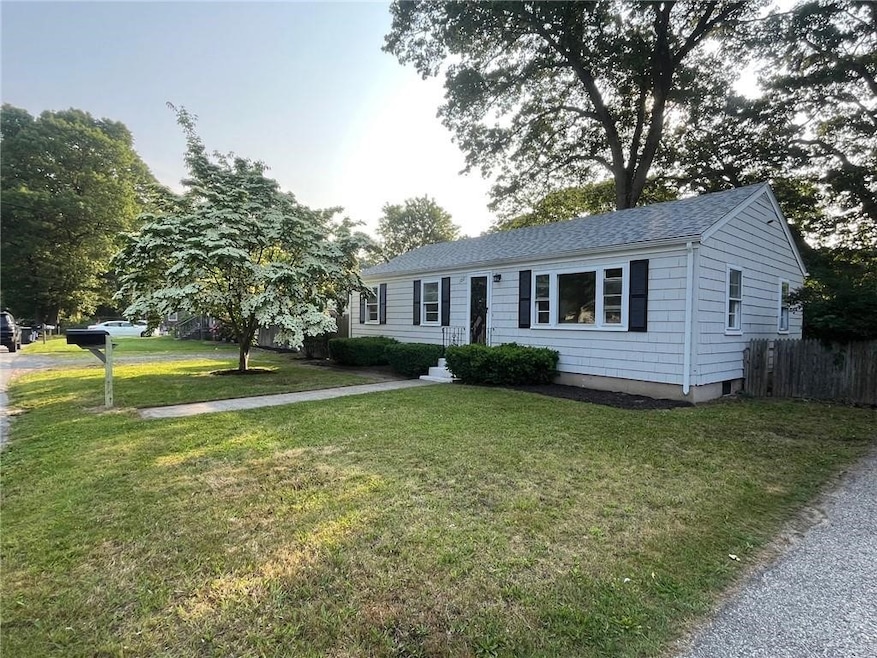


We have a charming single-family home nestled in a quiet neighborhood. This home features 3 bedrooms and 1 bathroom. The property is situated on a 0.15-acre lot, providing ample outdoor space for relaxation and activities.The interior boasts hardwood floors throughout, creating a warm and inviting atmosphere. The roof was recently done and is only 3 years old. The eat in kitchen is 5 years old, and offers functionality for everyday cooking needs. A spacious living area provides a comfortable setting for family gatherings and entertainment. The exterior of the home features a well-maintained fenced in yard, ideal for gardening or outdoor leisure. There is a large outsize, multi level deck that would also be ideal if you would like to purchase an above ground swimming pool. While the property does not include a garage, there is convenient off-street parking available for 4 cars. Located in a desirable area of Warwick, this home is close to local amenities, schools, and parks, making it an excellent choice for first-time homebuyers or those seeking a peaceful retreat.
Last Agent to Sell the Property
Lenox Realty Group License #RES.0034709 Listed on: 08/21/2025
| Date | Type | Sale Price | Title Company |
|---|---|---|---|
| Deed | $363,000 | -- | |
| Warranty Deed | -- | -- | |
| Warranty Deed | -- | -- | |
| Deed | $166,000 | -- | |
| Deed | $90,000 | -- |
| Date | Status | Loan Amount | Loan Type |
|---|---|---|---|
| Open | $356,425 | Purchase Money Mortgage | |
| Previous Owner | $137,736 | No Value Available | |
| Previous Owner | $160,050 | Purchase Money Mortgage | |
| Previous Owner | $89,165 | Purchase Money Mortgage |
| Date | Event | Price | List to Sale | Price per Sq Ft |
|---|---|---|---|---|
| 10/20/2025 10/20/25 | Sold | $363,000 | +1.1% | $378 / Sq Ft |
| 08/31/2025 08/31/25 | Pending | -- | -- | -- |
| 08/21/2025 08/21/25 | For Sale | $359,000 | -- | $374 / Sq Ft |
| Year | Tax Paid | Tax Assessment Tax Assessment Total Assessment is a certain percentage of the fair market value that is determined by local assessors to be the total taxable value of land and additions on the property. | Land | Improvement |
|---|---|---|---|---|
| 2025 | $3,701 | $291,400 | $101,600 | $189,800 |
| 2024 | $3,541 | $244,700 | $88,400 | $156,300 |
| 2023 | $3,472 | $244,700 | $88,400 | $156,300 |
| 2022 | $3,267 | $174,400 | $56,600 | $117,800 |
| 2021 | $3,267 | $174,400 | $56,600 | $117,800 |
| 2020 | $3,267 | $174,400 | $56,600 | $117,800 |
| 2019 | $3,267 | $174,400 | $56,600 | $117,800 |
| 2018 | $2,723 | $130,900 | $53,400 | $77,500 |
| 2017 | $2,649 | $130,900 | $53,400 | $77,500 |
| 2016 | $2,649 | $130,900 | $53,400 | $77,500 |
| 2015 | $2,351 | $113,300 | $55,400 | $57,900 |
| 2014 | $2,273 | $113,300 | $55,400 | $57,900 |
| 2013 | $2,242 | $113,300 | $55,400 | $57,900 |
Seller's Agent in 2025
Nicola Francis
Lenox Realty Group
(617) 447-9312
1 in this area
10 Total Sales
Buyer's Agent in 2025
Ralph Bello
RE/MAX Preferred
(401) 383-5553
1 in this area
65 Total Sales
Source: State-Wide MLS
MLS Number: 1393244
APN: WARW-000350-000265-000000
Disclaimer: Certain information contained herein is derived from information provided by parties other than Homes.com. All information provided is deemed reliable, but is not guaranteed to be accurate and should be independently verified.
![]() IDX information is provided exclusively for personal, non-commercial use, and may not be used for any purpose other than to identify prospective properties consumers may be interested in purchasing. Information is deemed reliable but not guaranteed.
IDX information is provided exclusively for personal, non-commercial use, and may not be used for any purpose other than to identify prospective properties consumers may be interested in purchasing. Information is deemed reliable but not guaranteed.
Copyright © 2026 State-Wide MLS, Inc. All rights reserved.
Ask me questions while you tour the home.