
Seller's Agent in 2018
Mike & Maria Real Estate
Waterfront Realty Group
(781) 974-3490
5 in this area
28 Total Sales


Estimated Value: $1,029,000 - $1,149,265
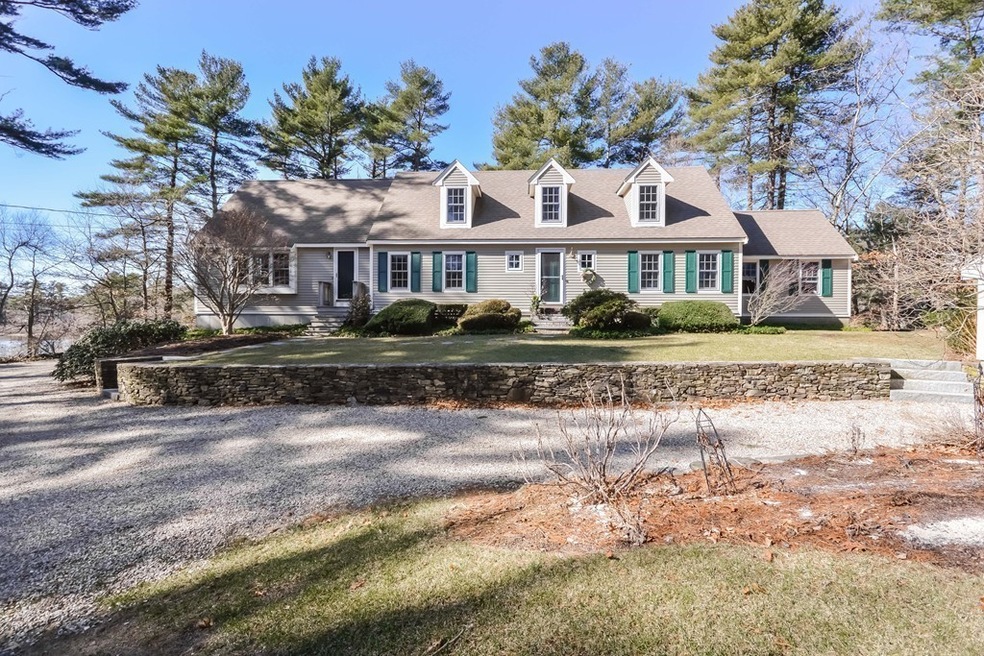
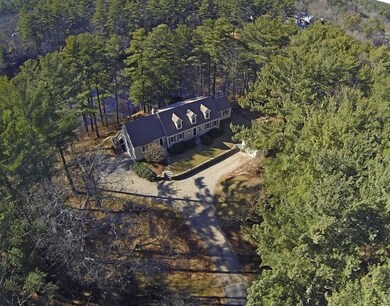
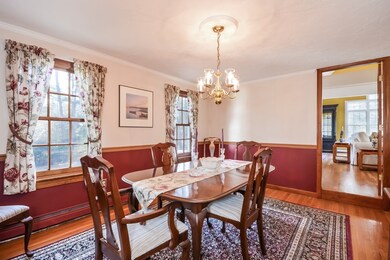
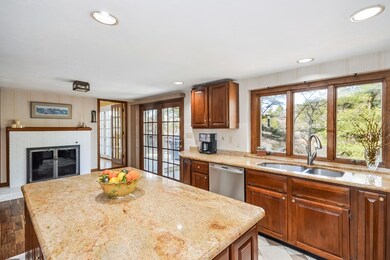
Peaceful waterfront retreat! Enjoy serene living in this gorgeous four bedroom expanded cape with direct access to Lower Chandler Mill Pond. Boasting with natural light, stunning water views, and a spacious floor plan this lovely home provides an amazing space for relaxing and entertaining. The first floor begins with an impressive great room featuring 16 foot high ceilings, beams with uplighting, gas fireplace with white carved mantle, and french doors that lead directly to your private back deck.Formal dining room leads to open gourmet kitchen with center island,ample storage and second fireplace.Bonus first floor laundry+ half bath, two additional bedrooms on first floor with den,+ full bath with claw foot tub create the perfect teen wing or guest suite.Unwind upstairs in the master wing with private balcony, newly updated bath, his&her vanities,whirpool tub,+ walk in shower. Pride in ownership shines with top of the line windows, new heating system & whole house generator. Wow!!
Last Agent to Sell the Property
Waterfront Realty Group Listed on: 02/28/2018
| Date | Buyer | Sale Price | Title Company |
|---|---|---|---|
| Turner Simon W | $695,000 | -- | |
| Thomas John N | $61,000 | -- |
| Date | Status | Borrower | Loan Amount |
|---|---|---|---|
| Open | Turner Simon W | $100,000 | |
| Open | Turner Simon W | $528,000 | |
| Closed | Turner Simon W | $538,000 | |
| Closed | Turner Simon W | $545,000 | |
| Previous Owner | Thomas John N | $390,000 | |
| Previous Owner | Thomas John N | $400,000 | |
| Previous Owner | Thomas John N | $100,000 |
| Date | Event | Price | Change | Sq Ft Price |
|---|---|---|---|---|
| 04/27/2018 04/27/18 | Sold | $695,000 | +1.6% | $246 / Sq Ft |
| 03/08/2018 03/08/18 | Pending | -- | -- | -- |
| 02/28/2018 02/28/18 | For Sale | $684,000 | -- | $242 / Sq Ft |
| Year | Tax Paid | Tax Assessment Tax Assessment Total Assessment is a certain percentage of the fair market value that is determined by local assessors to be the total taxable value of land and additions on the property. | Land | Improvement |
|---|---|---|---|---|
| 2025 | $10,100 | $996,100 | $385,600 | $610,500 |
| 2024 | $10,235 | $1,017,400 | $412,500 | $604,900 |
| 2023 | $8,764 | $819,800 | $367,600 | $452,200 |
| 2022 | $9,138 | $711,700 | $331,000 | $380,700 |
| 2021 | $9,144 | $631,500 | $268,600 | $362,900 |
| 2020 | $9,371 | $639,200 | $255,600 | $383,600 |
| 2019 | $9,322 | $635,000 | $249,700 | $385,300 |
| 2018 | $8,387 | $553,200 | $211,900 | $341,300 |
| 2017 | $8,118 | $523,400 | $197,000 | $326,400 |
| 2016 | $8,139 | $523,400 | $197,000 | $326,400 |
| 2015 | $8,165 | $523,400 | $197,000 | $326,400 |
Seller's Agent in 2018
Mike & Maria Real Estate
Waterfront Realty Group
(781) 974-3490
5 in this area
28 Total Sales
Buyer's Agent in 2018
Caroline Morson
Compass
(617) 968-4445
35 Total Sales
Source: MLS Property Information Network (MLS PIN)
MLS Number: 72287263
APN: DUXB-000018-000914-000117
Disclaimer: Certain information contained herein is derived from information provided by parties other than Homes.com. All information provided is deemed reliable, but is not guaranteed to be accurate and should be independently verified.
![]() The property listing data and information, or the Images, set forth herein were provided to MLS Property Information Network, Inc. from third party sources, including sellers, lessors and public records, and were compiled by MLS Property Information Network, Inc. The property listing data and information, and the Images, are for the personal, non-commercial use of consumers having a good faith interest in purchasing or leasing listed properties of the type displayed to them and may not be used for any purpose other than to identify prospective properties which such consumers may have a good faith interest in purchasing or leasing. MLS Property Information Network, Inc. and its subscribers disclaim any and all representations and warranties as to the accuracy of the property listing data and information, or as to the accuracy of any of the Images, set forth herein.
The property listing data and information, or the Images, set forth herein were provided to MLS Property Information Network, Inc. from third party sources, including sellers, lessors and public records, and were compiled by MLS Property Information Network, Inc. The property listing data and information, and the Images, are for the personal, non-commercial use of consumers having a good faith interest in purchasing or leasing listed properties of the type displayed to them and may not be used for any purpose other than to identify prospective properties which such consumers may have a good faith interest in purchasing or leasing. MLS Property Information Network, Inc. and its subscribers disclaim any and all representations and warranties as to the accuracy of the property listing data and information, or as to the accuracy of any of the Images, set forth herein.