100 Laurel St East Bridgewater, MA 02333
Estimated Value: $4,677,092
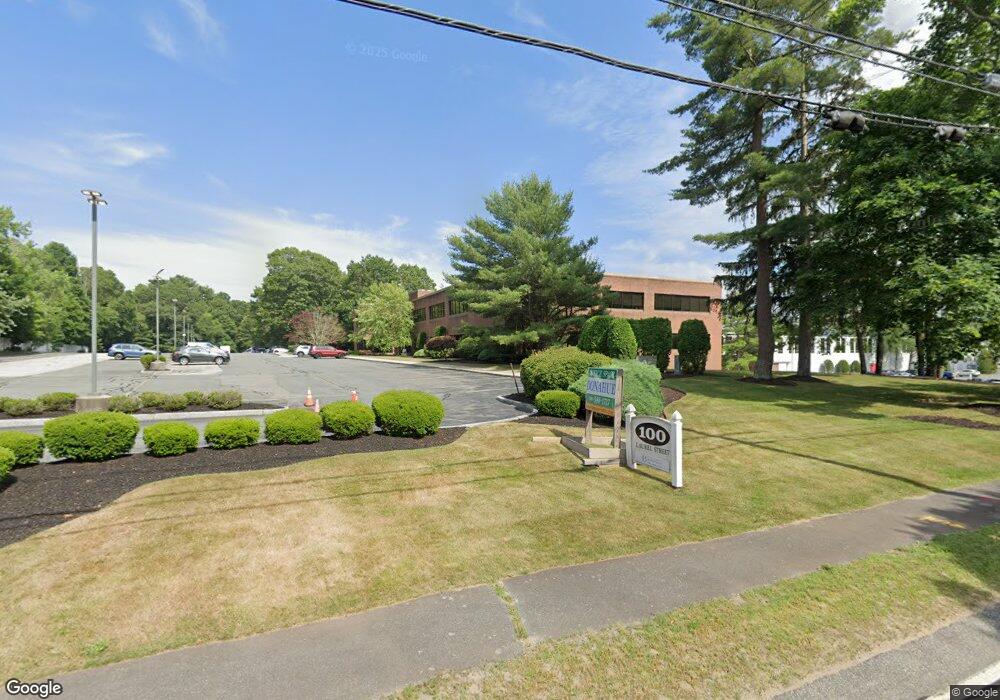
About This Home
This home is located at 100 Laurel St, East Bridgewater, MA 02333 and is currently estimated at $4,677,092, approximately $155 per square foot. 100 Laurel St is a home located in Plymouth County with nearby schools including Central Elementary School, Gordon W Mitchell Middle School, and East Bridgewater Jr./Sr. High School.
Ownership History
We collect this data history from publicly available records. To have your information removed, we recommend requesting removal directly through your county’s website.
Purchase Details
Home Financials for this Owner
Home Financials are based on the most recent Mortgage that was taken out on this home.Home Values in the Area
Average Home Value in this Area
Purchase History
We collect this data history from publicly available records. To have your information removed, we recommend requesting removal directly through your county’s website.
| Date | Buyer | Sale Price | Title Company |
|---|---|---|---|
| $3,200,000 | -- |
Mortgage History
We collect this data history from publicly available records. To have your information removed, we recommend requesting removal directly through your county’s website.
| Date | Status | Borrower | Loan Amount |
|---|---|---|---|
| Open | $1,920,000 |
Tax History
We collect this data history from publicly available records. To have your information removed, we recommend requesting removal directly through your county’s website.
| Year | Tax Paid | Tax Assessment Tax Assessment Total Assessment is a certain percentage of the fair market value that is determined by local assessors to be the total taxable value of land and additions on the property. | Land | Improvement |
|---|---|---|---|---|
| 2025 | $51,924 | $3,798,400 | $633,700 | $3,164,700 |
| 2024 | $50,524 | $3,650,600 | $609,300 | $3,041,300 |
| 2023 | $49,327 | $3,413,600 | $564,200 | $2,849,400 |
| 2022 | $50,828 | $3,258,200 | $545,100 | $2,713,100 |
| 2021 | $58,152 | $3,410,700 | $529,200 | $2,881,500 |
| 2020 | $54,149 | $3,131,800 | $509,700 | $2,622,100 |
| 2019 | $29,520 | $1,681,100 | $456,200 | $1,224,900 |
| 2018 | $30,376 | $1,691,300 | $456,200 | $1,235,100 |
| 2017 | $30,610 | $1,672,700 | $438,400 | $1,234,300 |
| 2016 | $30,371 | $1,672,400 | $429,500 | $1,242,900 |
| 2015 | $30,018 | $1,690,200 | $426,600 | $1,263,600 |
| 2014 | $30,099 | $1,732,800 | $417,700 | $1,315,100 |
Map
- 87 Union St
- 492 N Central St
- 452 N Central St
- 18 Captain Carlson Way Unit 18
- 31 Captain Carlson Way Unit 31
- 455 East St
- 126 N Central St
- 7 Autumn Way
- 208 Matfield St
- 541 Bedford St
- 625 Bedford St
- 38 West St
- 236 Elm St
- 20 Church Ave
- 61 Maple Ave
- 0 West St
- 62 Old Bedford Rd
- 98 Hobart St
- 40 Water St
- 39 Friendship Dr
Ask me questions while you tour the home.