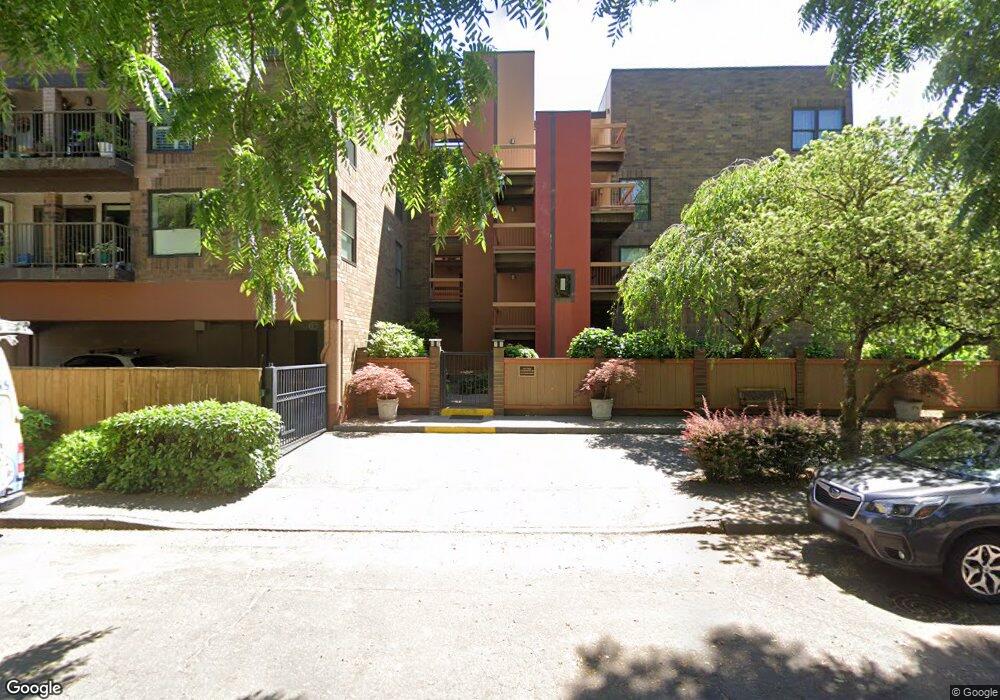
100 Leonard St Unit 3-1 Lake Oswego, OR 97034
Foothills NeighborhoodEstimated Value: $430,448 - $530,000
2
Beds
2
Baths
1,364
Sq Ft
$358/Sq Ft
Est. Value
About This Home
This home is located at 100 Leonard St Unit 3-1, Lake Oswego, OR 97034 and is currently estimated at $488,862, approximately $358 per square foot. 100 Leonard St Unit 3-1 is a home located in Clackamas County with nearby schools including Hallinan Elementary School, Lakeridge Middle School, and Lakeridge High School.
Ownership History
Date
Name
Owned For
Owner Type
Purchase Details
Closed on
Jun 29, 2016
Sold by
Morris Marilyn J
Bought by
Kaufman Caroline Louise and Caroline Louise Kaufman Trust
Current Estimated Value
Home Financials for this Owner
Home Financials are based on the most recent Mortgage that was taken out on this home.
Original Mortgage
$200,000
Outstanding Balance
$158,798
Interest Rate
3.58%
Mortgage Type
Commercial
Estimated Equity
$330,064
Purchase Details
Closed on
Jun 25, 2010
Sold by
Mary Alice Richardson Trust
Bought by
Morris Marilyn J
Home Financials for this Owner
Home Financials are based on the most recent Mortgage that was taken out on this home.
Original Mortgage
$140,000
Interest Rate
4.82%
Mortgage Type
Commercial
Purchase Details
Closed on
Jun 13, 1995
Sold by
Richardson Mary A
Bought by
Richardson Mary Alice and The Mary Alice Richardson Trust
Create a Home Valuation Report for This Property
The Home Valuation Report is an in-depth analysis detailing your home's value as well as a comparison with similar homes in the area
Home Values in the Area
Average Home Value in this Area
Purchase History
| Date | Buyer | Sale Price | Title Company |
|---|---|---|---|
| Kaufman Caroline Louise | $250,000 | Ticor Title | |
| Morris Marilyn J | $175,000 | Lawyers Title Insurance Corp | |
| Richardson Mary Alice | -- | -- |
Source: Public Records
Mortgage History
| Date | Status | Borrower | Loan Amount |
|---|---|---|---|
| Open | Kaufman Caroline Louise | $200,000 | |
| Previous Owner | Morris Marilyn J | $140,000 |
Source: Public Records
Tax History Compared to Growth
Tax History
| Year | Tax Paid | Tax Assessment Tax Assessment Total Assessment is a certain percentage of the fair market value that is determined by local assessors to be the total taxable value of land and additions on the property. | Land | Improvement |
|---|---|---|---|---|
| 2025 | $3,793 | $197,949 | -- | -- |
| 2024 | $3,692 | $192,184 | -- | -- |
| 2023 | $3,692 | $186,587 | $0 | $0 |
| 2022 | $3,477 | $181,153 | $0 | $0 |
| 2021 | $3,211 | $175,877 | $0 | $0 |
| 2020 | $3,131 | $170,755 | $0 | $0 |
| 2019 | $3,054 | $165,782 | $0 | $0 |
| 2018 | $2,904 | $160,953 | $0 | $0 |
| 2017 | $2,802 | $156,265 | $0 | $0 |
| 2016 | $2,550 | $151,714 | $0 | $0 |
| 2015 | $2,459 | $147,295 | $0 | $0 |
| 2014 | $2,324 | $143,005 | $0 | $0 |
Source: Public Records
Map
Nearby Homes
- 420 S State St
- 161 3rd St
- 668 Mcvey Ave Unit 83
- 408 Ridgeway Rd
- 16200 Pacific Hwy Unit 4
- 600 Maple St
- 990 Lund St
- 217 5th St
- 589 Ridgeway Rd
- 14411 SE Wagner Ln
- 200 Burnham Rd Unit 200
- 527 2nd St Unit 101
- 116 6th St
- 382 5th St
- 580 2nd St Unit 1
- 15323 SE Fairoaks Ave
- 436 5th St
- 985 SE Rim Rock Ln
- 530 4th St Unit 13
- 16081 Pearcy St
- 100 Leonard St Unit 2-3
- 100 Leonard St Unit 3
- 100 Leonard St Unit 2-4
- 100 Leonard St
- 100 Leonard St Unit 4-1
- 100 Leonard St Unit 2-2
- 100 Leonard St Unit 4-2
- 100 Leonard St Unit 2-1
- 121 Wilbur St
- 121 Wilbur St Unit A2
- 144 Leonard St
- 121 Leonard Stunit C
- 68 Leonard St
- 121 Leonard St Unit E
- 121 Leonard St Unit F
- 121 Leonard St Unit A
- 121 Leonard St Unit C
- 190 Furnace St
- 140 Furnace St
- 120 Furnace St