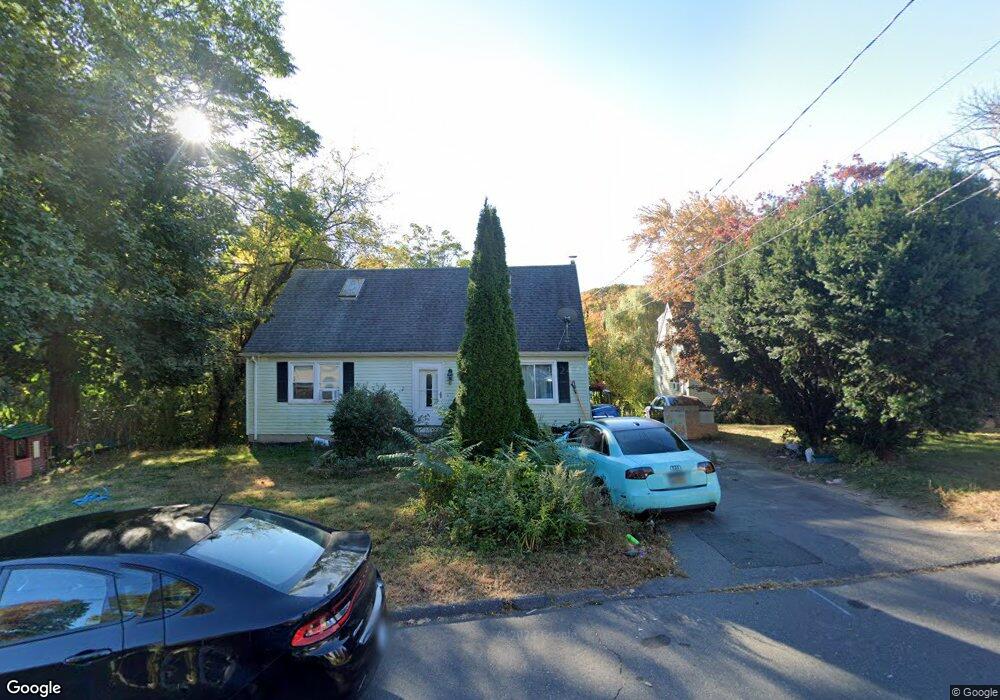
100 Lewis Rd Bristol, CT 06010
North Bristol NeighborhoodEstimated Value: $276,000 - $323,000
3
Beds
2
Baths
1,426
Sq Ft
$217/Sq Ft
Est. Value
About This Home
This home is located at 100 Lewis Rd, Bristol, CT 06010 and is currently estimated at $308,812, approximately $216 per square foot. 100 Lewis Rd is a home located in Hartford County with nearby schools including Stafford School, Chippens Hill Middle School, and Bristol Eastern High School.
Ownership History
Date
Name
Owned For
Owner Type
Purchase Details
Closed on
Feb 23, 2011
Sold by
Samuel Frank L and Jenkins Jodi
Bought by
Linden Frank and Linden Kathleen
Current Estimated Value
Home Financials for this Owner
Home Financials are based on the most recent Mortgage that was taken out on this home.
Original Mortgage
$100,000
Outstanding Balance
$68,752
Interest Rate
4.88%
Estimated Equity
$240,060
Purchase Details
Closed on
Aug 17, 2005
Sold by
Peery Kimberly A
Bought by
Jenkins Jodi and Samuel Frank L
Home Financials for this Owner
Home Financials are based on the most recent Mortgage that was taken out on this home.
Original Mortgage
$151,200
Interest Rate
5.5%
Purchase Details
Closed on
Oct 20, 1999
Sold by
Kurban Thomas E and Kurban Donna
Bought by
Bulawa Kimberly
Home Financials for this Owner
Home Financials are based on the most recent Mortgage that was taken out on this home.
Original Mortgage
$108,500
Interest Rate
7.83%
Create a Home Valuation Report for This Property
The Home Valuation Report is an in-depth analysis detailing your home's value as well as a comparison with similar homes in the area
Home Values in the Area
Average Home Value in this Area
Purchase History
| Date | Buyer | Sale Price | Title Company |
|---|---|---|---|
| Linden Frank | -- | -- | |
| Jenkins Jodi | $189,000 | -- | |
| Bulawa Kimberly | $110,000 | -- |
Source: Public Records
Mortgage History
| Date | Status | Borrower | Loan Amount |
|---|---|---|---|
| Open | Bulawa Kimberly | $100,000 | |
| Previous Owner | Bulawa Kimberly | $151,200 | |
| Previous Owner | Bulawa Kimberly | $37,800 | |
| Previous Owner | Bulawa Kimberly | $108,500 |
Source: Public Records
Tax History Compared to Growth
Tax History
| Year | Tax Paid | Tax Assessment Tax Assessment Total Assessment is a certain percentage of the fair market value that is determined by local assessors to be the total taxable value of land and additions on the property. | Land | Improvement |
|---|---|---|---|---|
| 2025 | $5,299 | $157,010 | $37,450 | $119,560 |
| 2024 | $5,210 | $163,590 | $37,450 | $126,140 |
| 2023 | $4,965 | $163,590 | $37,450 | $126,140 |
| 2022 | $4,405 | $114,870 | $28,350 | $86,520 |
| 2021 | $4,405 | $114,870 | $28,350 | $86,520 |
| 2020 | $4,405 | $114,870 | $28,350 | $86,520 |
| 2019 | $4,371 | $114,870 | $28,350 | $86,520 |
| 2018 | $4,236 | $114,870 | $28,350 | $86,520 |
| 2017 | $4,192 | $116,340 | $40,530 | $75,810 |
| 2016 | $4,192 | $116,340 | $40,530 | $75,810 |
| 2015 | $4,027 | $116,340 | $40,530 | $75,810 |
| 2014 | $4,027 | $116,340 | $40,530 | $75,810 |
Source: Public Records
Map
Nearby Homes