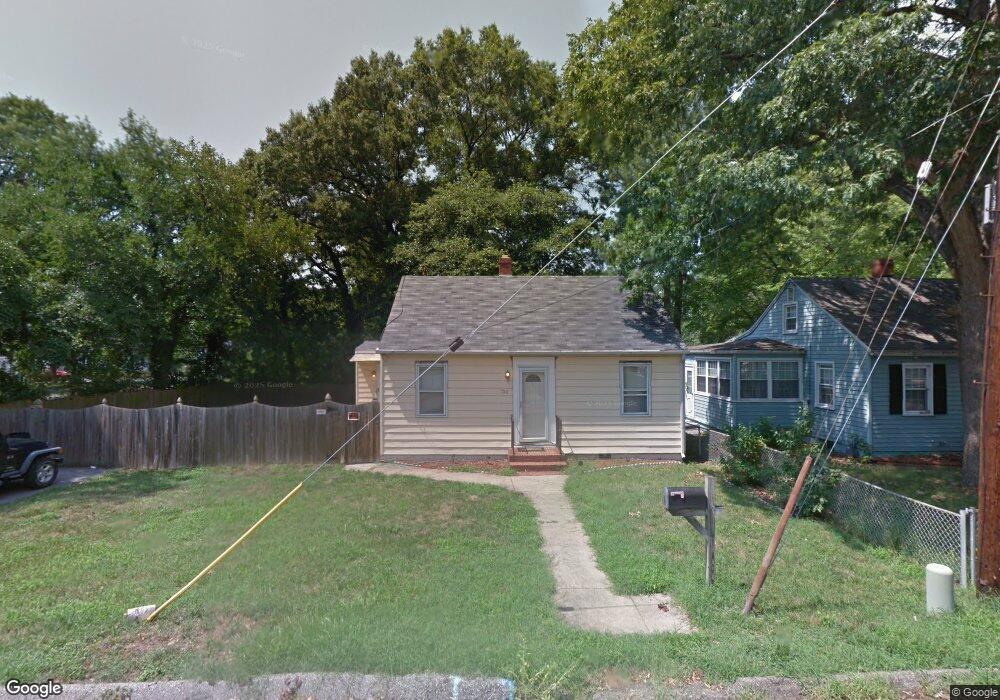
100 Linden Ln Glen Burnie, MD 21061
Estimated Value: $309,000 - $338,000
--
Bed
1
Bath
1,168
Sq Ft
$277/Sq Ft
Est. Value
About This Home
This home is located at 100 Linden Ln, Glen Burnie, MD 21061 and is currently estimated at $323,002, approximately $276 per square foot. 100 Linden Ln is a home located in Anne Arundel County with nearby schools including Richard Henry Lee Elementary School, Corkran Middle School, and Glen Burnie High School.
Ownership History
Date
Name
Owned For
Owner Type
Purchase Details
Closed on
Sep 10, 2004
Sold by
Radford R Y L
Bought by
Radford Randy L
Current Estimated Value
Purchase Details
Closed on
May 7, 1998
Sold by
Collinson Gloria A
Bought by
Radford Randy L and Lawall Jennifer N
Create a Home Valuation Report for This Property
The Home Valuation Report is an in-depth analysis detailing your home's value as well as a comparison with similar homes in the area
Home Values in the Area
Average Home Value in this Area
Purchase History
| Date | Buyer | Sale Price | Title Company |
|---|---|---|---|
| Radford Randy L | -- | -- | |
| Radford Randy L | $92,500 | -- |
Source: Public Records
Mortgage History
| Date | Status | Borrower | Loan Amount |
|---|---|---|---|
| Closed | Radford Randy L | -- |
Source: Public Records
Tax History Compared to Growth
Tax History
| Year | Tax Paid | Tax Assessment Tax Assessment Total Assessment is a certain percentage of the fair market value that is determined by local assessors to be the total taxable value of land and additions on the property. | Land | Improvement |
|---|---|---|---|---|
| 2025 | $2,972 | $237,100 | $146,700 | $90,400 |
| 2024 | $2,972 | $225,500 | $0 | $0 |
| 2023 | $2,810 | $213,900 | $0 | $0 |
| 2022 | $2,544 | $202,300 | $126,700 | $75,600 |
| 2021 | $2,384 | $196,600 | $0 | $0 |
| 2020 | $2,384 | $190,900 | $0 | $0 |
| 2019 | $2,326 | $185,200 | $111,700 | $73,500 |
| 2018 | $2,241 | $183,267 | $0 | $0 |
| 2017 | $2,231 | $181,333 | $0 | $0 |
| 2016 | -- | $179,400 | $0 | $0 |
| 2015 | -- | $169,700 | $0 | $0 |
| 2014 | -- | $160,000 | $0 | $0 |
Source: Public Records
Map
Nearby Homes
- 108 New Jersey Ave NW
- 108 1st Ave SW
- 611 Glenview Ave
- 301 Newfield Rd
- 305 Newfield Rd
- 100 3rd Ave SE
- 106 3rd Ave SE
- 420 Lincoln Ave SW
- 330 New Jersey Ave NE
- 7517 Baltimore Annapolis Blvd
- 102 Kent Rd
- 209 Lincoln Ave SW
- 207 Lincoln Ave SW
- 625 Newfield Rd
- 0 Ritchie Hwy
- 102 Kuethe Rd NE
- 618 Stewart Ave
- 114 Olen Dr
- 101 Kuethe Rd NE
- 102 Garrett Rd
- 102 Linden Ln
- 104 Linden Ln
- 101 Linden Ln
- 103 Linden Ln
- 106 Linden Ln
- 7 D St NW
- 105 Linden Ln
- 107 Linden Ln
- 7408 Baltimore Annapolis Blvd
- 100 Chestnut Ln
- 102 Chestnut Ln
- 7410 Baltimore Annapolis Blvd
- 7412 Baltimore Annapolis Blvd Unit B
- 7412 Baltimore Annapolis Blvd
- 215 Greenway St NW
- 104 Chestnut Ln
- 5 D St NW
- 7414 Baltimore Annapolis Blvd
- 213 Greenway St NW
- 106 Chestnut Ln