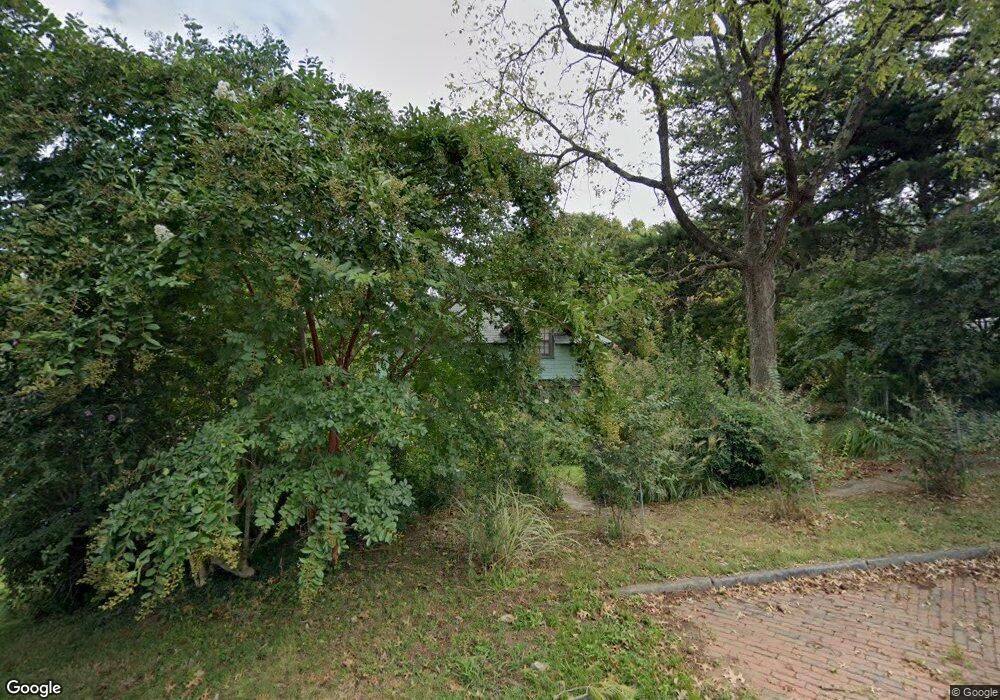
100 Madison St Lynchburg, VA 24504
Garland Hill NeighborhoodEstimated Value: $127,000 - $169,796
--
Bed
1
Bath
947
Sq Ft
$152/Sq Ft
Est. Value
About This Home
This home is located at 100 Madison St, Lynchburg, VA 24504 and is currently estimated at $144,199, approximately $152 per square foot. 100 Madison St is a home located in Lynchburg City with nearby schools including Bedford Hills Elementary School, Linkhorne Middle School, and E.C. Glass High School.
Ownership History
Date
Name
Owned For
Owner Type
Purchase Details
Closed on
Jun 8, 2005
Sold by
Endlshyer Heather E
Bought by
Frick Keith A and Lee Lawrence Borden
Current Estimated Value
Home Financials for this Owner
Home Financials are based on the most recent Mortgage that was taken out on this home.
Original Mortgage
$62,400
Outstanding Balance
$29,900
Interest Rate
4.5%
Mortgage Type
Adjustable Rate Mortgage/ARM
Estimated Equity
$114,299
Create a Home Valuation Report for This Property
The Home Valuation Report is an in-depth analysis detailing your home's value as well as a comparison with similar homes in the area
Home Values in the Area
Average Home Value in this Area
Purchase History
| Date | Buyer | Sale Price | Title Company |
|---|---|---|---|
| Frick Keith A | -- | None Available |
Source: Public Records
Mortgage History
| Date | Status | Borrower | Loan Amount |
|---|---|---|---|
| Open | Frick Keith A | $62,400 |
Source: Public Records
Tax History Compared to Growth
Tax History
| Year | Tax Paid | Tax Assessment Tax Assessment Total Assessment is a certain percentage of the fair market value that is determined by local assessors to be the total taxable value of land and additions on the property. | Land | Improvement |
|---|---|---|---|---|
| 2025 | $1,126 | $134,000 | $61,300 | $72,700 |
| 2024 | $781 | $87,700 | $32,200 | $55,500 |
| 2023 | $195 | $87,700 | $32,200 | $55,500 |
| 2022 | $766 | $74,400 | $24,000 | $50,400 |
| 2021 | $826 | $74,400 | $24,000 | $50,400 |
| 2020 | $808 | $72,800 | $22,500 | $50,300 |
| 2019 | $808 | $72,800 | $22,500 | $50,300 |
| 2018 | $983 | $88,600 | $12,500 | $76,100 |
| 2017 | $983 | $88,600 | $12,500 | $76,100 |
| 2016 | $983 | $88,600 | $12,500 | $76,100 |
| 2015 | $983 | $88,600 | $12,500 | $76,100 |
| 2014 | $983 | $88,600 | $12,500 | $76,100 |
Source: Public Records
Map
Nearby Homes