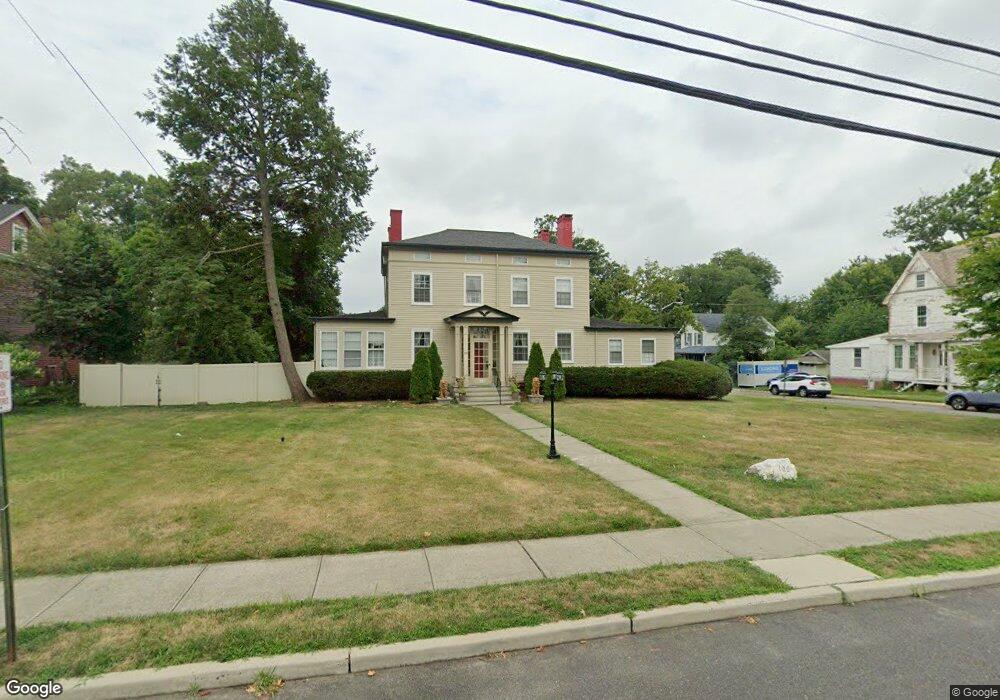
100 Main St Keyport, NJ 07735
Estimated Value: $660,000 - $926,000
4
Beds
2
Baths
2,980
Sq Ft
$260/Sq Ft
Est. Value
About This Home
This home is located at 100 Main St, Keyport, NJ 07735 and is currently estimated at $774,003, approximately $259 per square foot. 100 Main St is a home located in Monmouth County with nearby schools including Keyport Central School, Keyport High School, and Icob Academy.
Ownership History
Date
Name
Owned For
Owner Type
Purchase Details
Closed on
Jan 16, 2018
Sold by
Donaldson Edwin H and Donaldson Judith A
Bought by
Zhou Fu Li and Dong Huo Lian
Current Estimated Value
Home Financials for this Owner
Home Financials are based on the most recent Mortgage that was taken out on this home.
Original Mortgage
$240,000
Outstanding Balance
$202,532
Interest Rate
3.94%
Mortgage Type
Adjustable Rate Mortgage/ARM
Estimated Equity
$571,471
Purchase Details
Closed on
Feb 22, 1978
Bought by
Donaldson Edwin H and Donaldson Judith A
Create a Home Valuation Report for This Property
The Home Valuation Report is an in-depth analysis detailing your home's value as well as a comparison with similar homes in the area
Home Values in the Area
Average Home Value in this Area
Purchase History
| Date | Buyer | Sale Price | Title Company |
|---|---|---|---|
| Zhou Fu Li | $300,000 | None Available | |
| Donaldson Edwin H | -- | -- |
Source: Public Records
Mortgage History
| Date | Status | Borrower | Loan Amount |
|---|---|---|---|
| Open | Zhou Fu Li | $240,000 |
Source: Public Records
Tax History Compared to Growth
Tax History
| Year | Tax Paid | Tax Assessment Tax Assessment Total Assessment is a certain percentage of the fair market value that is determined by local assessors to be the total taxable value of land and additions on the property. | Land | Improvement |
|---|---|---|---|---|
| 2025 | $12,757 | $673,300 | $252,100 | $421,200 |
| 2024 | $12,623 | $616,300 | $215,800 | $400,500 |
| 2023 | $12,623 | $574,300 | $196,200 | $378,100 |
| 2022 | $11,562 | $499,300 | $170,600 | $328,700 |
| 2021 | $11,562 | $458,100 | $158,000 | $300,100 |
| 2020 | $11,154 | $438,600 | $153,200 | $285,400 |
| 2019 | $10,857 | $427,600 | $148,700 | $278,900 |
| 2018 | $11,671 | $448,900 | $159,800 | $289,100 |
| 2017 | $11,489 | $440,700 | $155,300 | $285,400 |
| 2016 | $11,118 | $430,100 | $155,300 | $274,800 |
| 2015 | $10,723 | $412,900 | $141,800 | $271,100 |
| 2014 | $10,260 | $398,900 | $119,300 | $279,600 |
Source: Public Records
Map
Nearby Homes
- 69 Maple Place
- 226 Osborn St
- 9 Monmouth Place
- 40 Church St
- 55 E Front St
- 195 Atlantic St
- 8 Chingarora Ave
- 95 Broadway
- 128 1st St
- 73 2nd St
- 231 Atlantic St Unit 23
- 25-27 Brook Ave
- 72 Manchester Ave
- 74 Manchester Ave
- 127 Chingarora Ave
- 90 Saint Peters Place
- 253 Broadway
- 162 2nd St
- 37 Myrtle Ave
- 194 Washington St