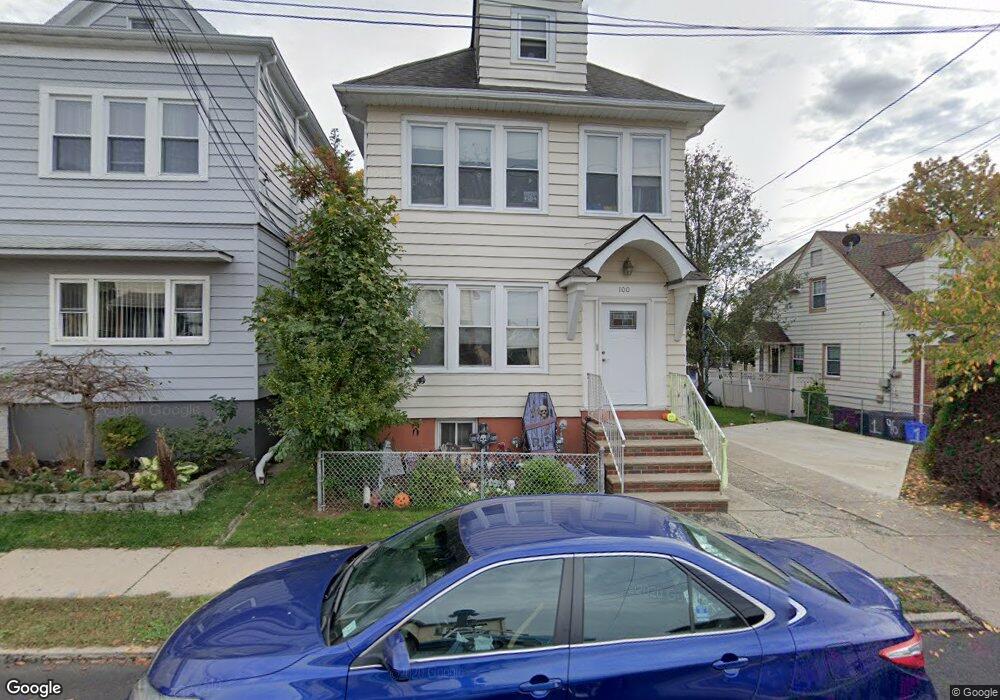
100 Market St Unit 1 Garfield, NJ 07026
Estimated Value: $558,000 - $794,000
2
Beds
1
Bath
1,890
Sq Ft
$347/Sq Ft
Est. Value
About This Home
This home is located at 100 Market St Unit 1, Garfield, NJ 07026 and is currently estimated at $656,086, approximately $347 per square foot. 100 Market St Unit 1 is a home located in Bergen County with nearby schools including Garfield High School and Rainbow Montessori School - Clifton.
Ownership History
Date
Name
Owned For
Owner Type
Purchase Details
Closed on
Jul 21, 2020
Sold by
Shg Montvale Mb Llc
Bought by
Shg Montvale Mb Ir Llc
Current Estimated Value
Purchase Details
Closed on
Jan 9, 2016
Sold by
Triolo Ronald and Triolo Diane
Bought by
Cudnik Radoslaw and Cudnik Eliza
Home Financials for this Owner
Home Financials are based on the most recent Mortgage that was taken out on this home.
Original Mortgage
$250,000
Interest Rate
3.36%
Mortgage Type
New Conventional
Purchase Details
Closed on
Jun 1, 2004
Sold by
Stanley Ciesla Est Of
Bought by
Triolo Ronald and Triolo Diane
Home Financials for this Owner
Home Financials are based on the most recent Mortgage that was taken out on this home.
Original Mortgage
$162,500
Interest Rate
6.12%
Create a Home Valuation Report for This Property
The Home Valuation Report is an in-depth analysis detailing your home's value as well as a comparison with similar homes in the area
Home Values in the Area
Average Home Value in this Area
Purchase History
| Date | Buyer | Sale Price | Title Company |
|---|---|---|---|
| Shg Montvale Mb Ir Llc | -- | Insight Title Services Llc | |
| Shg Montvale Mb I Llc | -- | Insight Title Services Llc | |
| Cudnik Radoslaw | $316,000 | Old Republic National Title | |
| Triolo Ronald | $350,000 | -- |
Source: Public Records
Mortgage History
| Date | Status | Borrower | Loan Amount |
|---|---|---|---|
| Previous Owner | Cudnik Radoslaw | $250,000 | |
| Previous Owner | Triolo Ronald | $162,500 |
Source: Public Records
Tax History Compared to Growth
Tax History
| Year | Tax Paid | Tax Assessment Tax Assessment Total Assessment is a certain percentage of the fair market value that is determined by local assessors to be the total taxable value of land and additions on the property. | Land | Improvement |
|---|---|---|---|---|
| 2025 | $9,107 | $272,900 | $125,000 | $147,900 |
| 2024 | $8,954 | $272,900 | $125,000 | $147,900 |
| 2023 | $8,512 | $272,900 | $125,000 | $147,900 |
| 2022 | $8,512 | $272,900 | $125,000 | $147,900 |
| 2021 | $8,263 | $272,900 | $125,000 | $147,900 |
| 2020 | $8,083 | $272,900 | $125,000 | $147,900 |
| 2019 | $7,930 | $272,900 | $125,000 | $147,900 |
| 2018 | $7,753 | $272,900 | $125,000 | $147,900 |
| 2017 | $7,617 | $272,900 | $125,000 | $147,900 |
| 2016 | $7,390 | $272,900 | $125,000 | $147,900 |
| 2015 | $7,207 | $272,900 | $125,000 | $147,900 |
| 2014 | $7,016 | $272,900 | $125,000 | $147,900 |
Source: Public Records
Map
Nearby Homes