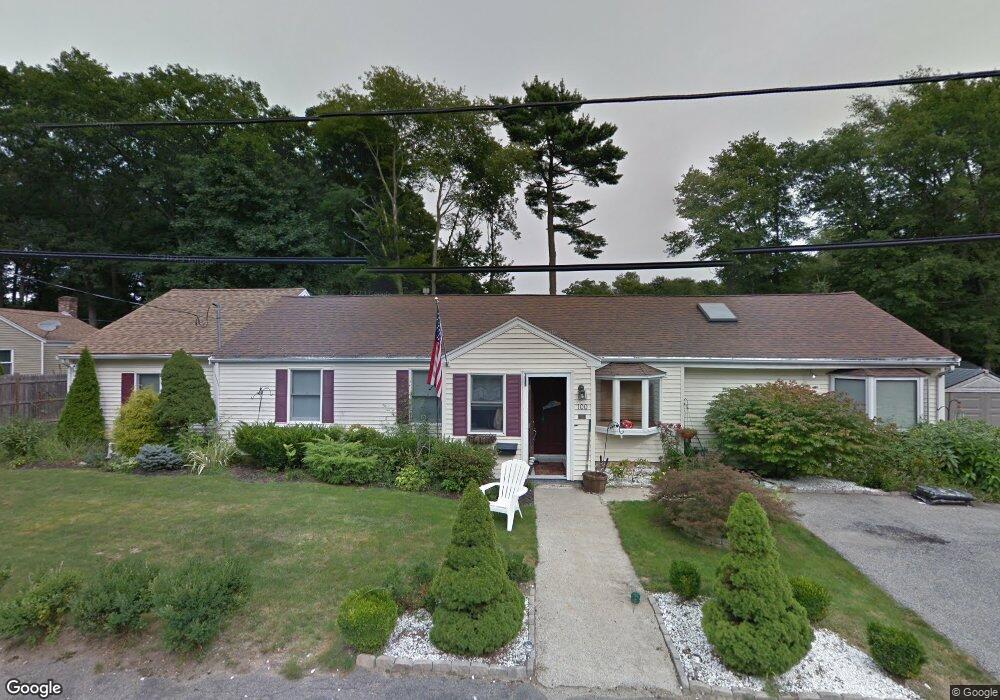
100 Mercury St Weymouth, MA 02188
South Weymouth NeighborhoodEstimated Value: $640,642 - $720,000
4
Beds
1
Bath
1,372
Sq Ft
$487/Sq Ft
Est. Value
About This Home
This home is located at 100 Mercury St, Weymouth, MA 02188 and is currently estimated at $667,911, approximately $486 per square foot. 100 Mercury St is a home located in Norfolk County with nearby schools including Thomas V Nash, Abigail Adams Middle School, and Weymouth Middle School Chapman.
Ownership History
Date
Name
Owned For
Owner Type
Purchase Details
Closed on
Aug 27, 1999
Sold by
Howley Michael J and Howley Linda M
Bought by
Enos Mcihael S and Enos Sawn M
Current Estimated Value
Home Financials for this Owner
Home Financials are based on the most recent Mortgage that was taken out on this home.
Original Mortgage
$167,894
Outstanding Balance
$48,667
Interest Rate
7.53%
Mortgage Type
Purchase Money Mortgage
Estimated Equity
$619,244
Purchase Details
Closed on
May 26, 1989
Sold by
Hagan Edward F
Bought by
Howley Michael J
Create a Home Valuation Report for This Property
The Home Valuation Report is an in-depth analysis detailing your home's value as well as a comparison with similar homes in the area
Home Values in the Area
Average Home Value in this Area
Purchase History
| Date | Buyer | Sale Price | Title Company |
|---|---|---|---|
| Enos Mcihael S | $170,000 | -- | |
| Howley Michael J | $136,500 | -- |
Source: Public Records
Mortgage History
| Date | Status | Borrower | Loan Amount |
|---|---|---|---|
| Open | Howley Michael J | $57,250 | |
| Closed | Howley Michael J | $35,000 | |
| Closed | Howley Michael J | $16,294 | |
| Open | Howley Michael J | $167,894 |
Source: Public Records
Tax History Compared to Growth
Tax History
| Year | Tax Paid | Tax Assessment Tax Assessment Total Assessment is a certain percentage of the fair market value that is determined by local assessors to be the total taxable value of land and additions on the property. | Land | Improvement |
|---|---|---|---|---|
| 2025 | $5,488 | $543,400 | $208,200 | $335,200 |
| 2024 | $5,368 | $522,700 | $198,300 | $324,400 |
| 2023 | $5,108 | $488,800 | $183,600 | $305,200 |
| 2022 | $5,058 | $441,400 | $170,000 | $271,400 |
| 2021 | $4,703 | $400,600 | $170,000 | $230,600 |
| 2020 | $4,508 | $378,200 | $170,000 | $208,200 |
| 2019 | $4,318 | $356,300 | $163,500 | $192,800 |
| 2018 | $4,183 | $334,600 | $155,700 | $178,900 |
| 2017 | $4,013 | $313,300 | $148,300 | $165,000 |
| 2016 | $3,747 | $292,700 | $142,600 | $150,100 |
| 2015 | $3,629 | $281,300 | $142,600 | $138,700 |
| 2014 | $3,385 | $254,500 | $119,400 | $135,100 |
Source: Public Records
Map
Nearby Homes
- 92 Mercury St
- 262 West St
- 255 West St
- 308 Forest St
- 16 Jay Rd
- 24 Fisher Rd
- 655 Summer St
- 68 Massapoag St Unit 7
- 2 Mitchell Ln Unit B
- 501 Commerce Dr Unit 2310
- 501 Commerce Dr Unit 1111
- 501 Commerce Dr Unit 4206
- 501 Commerce Dr Unit 4308
- 501 Commerce Dr Unit 4306
- 116 Belmont St
- 441 Grove St
- 432 Grove St
- 27 Park Ave
- 354 Tilden Commons Ln
- 134 Tyson Commons Ln