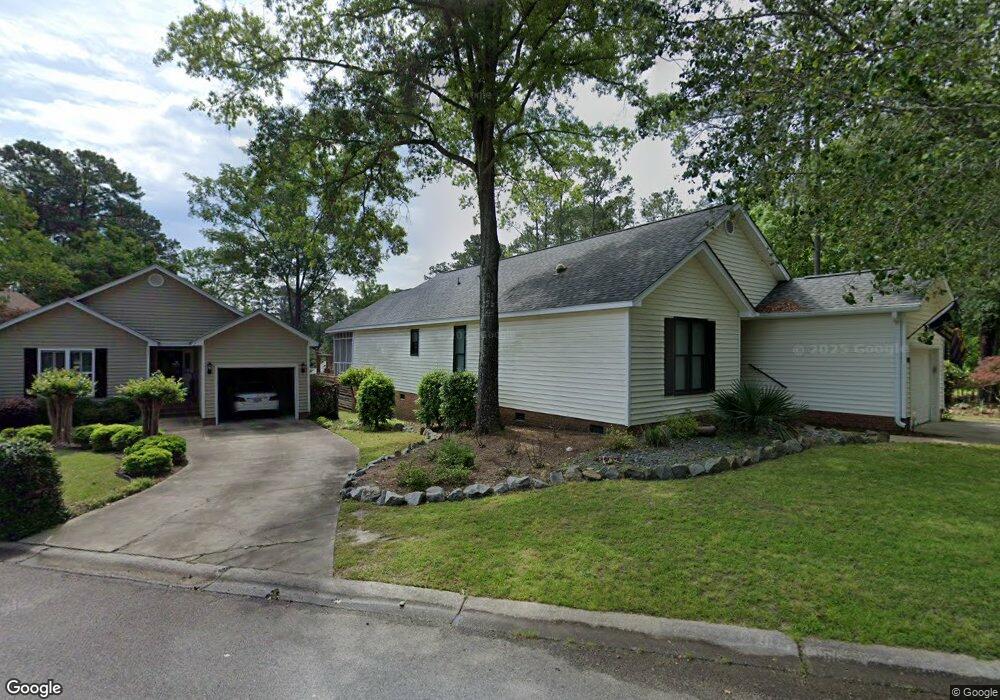
100 Murray Point Ln Chapin, SC 29036
Estimated Value: $462,303 - $719,000
3
Beds
2
Baths
1,742
Sq Ft
$307/Sq Ft
Est. Value
About This Home
This home is located at 100 Murray Point Ln, Chapin, SC 29036 and is currently estimated at $535,326, approximately $307 per square foot. 100 Murray Point Ln is a home located in Richland County with nearby schools including Lake Murray Elementary School, Chapin Intermediate, and Chapin High School.
Ownership History
Date
Name
Owned For
Owner Type
Purchase Details
Closed on
Jan 25, 2021
Sold by
Turner Joseph D and Page Cheryl
Bought by
Turner Joseph D and Turner Cheryl P
Current Estimated Value
Home Financials for this Owner
Home Financials are based on the most recent Mortgage that was taken out on this home.
Original Mortgage
$290,000
Outstanding Balance
$210,377
Interest Rate
2.67%
Mortgage Type
New Conventional
Estimated Equity
$324,949
Purchase Details
Closed on
May 28, 2004
Sold by
Abbott Ronald C and Abbott Donna R
Bought by
Turner Joseph D and Page Cheryl
Home Financials for this Owner
Home Financials are based on the most recent Mortgage that was taken out on this home.
Original Mortgage
$232,750
Interest Rate
5.89%
Mortgage Type
Purchase Money Mortgage
Create a Home Valuation Report for This Property
The Home Valuation Report is an in-depth analysis detailing your home's value as well as a comparison with similar homes in the area
Home Values in the Area
Average Home Value in this Area
Purchase History
| Date | Buyer | Sale Price | Title Company |
|---|---|---|---|
| Turner Joseph D | -- | None Available | |
| Turner Joseph D | -- | None Listed On Document | |
| Turner Joseph D | $245,000 | -- |
Source: Public Records
Mortgage History
| Date | Status | Borrower | Loan Amount |
|---|---|---|---|
| Open | Turner Joseph D | $290,000 | |
| Closed | Turner Joseph D | $290,000 | |
| Previous Owner | Turner Joseph D | $232,750 |
Source: Public Records
Tax History
| Year | Tax Paid | Tax Assessment Tax Assessment Total Assessment is a certain percentage of the fair market value that is determined by local assessors to be the total taxable value of land and additions on the property. | Land | Improvement |
|---|---|---|---|---|
| 2024 | $2,711 | $322,500 | $0 | $0 |
| 2023 | $2,606 | $11,220 | $0 | $0 |
| 2022 | $2,257 | $280,500 | $152,200 | $128,300 |
| 2021 | $2,286 | $11,220 | $0 | $0 |
| 2020 | $2,394 | $11,220 | $0 | $0 |
| 2019 | $2,383 | $11,220 | $0 | $0 |
| 2018 | $1,872 | $9,760 | $0 | $0 |
| 2017 | $1,823 | $9,760 | $0 | $0 |
| 2016 | $1,814 | $9,760 | $0 | $0 |
| 2015 | $1,824 | $9,760 | $0 | $0 |
| 2014 | $1,819 | $243,900 | $0 | $0 |
| 2013 | -- | $9,760 | $0 | $0 |
Source: Public Records
Map
Nearby Homes
- 226 Wahoo Cir
- 111 Wahoo Cir
- 180 Wahoo Cir
- 280 Wahoo Cir
- 13 East Dr
- 514 Shadowood Dr
- 13 Morning Breeze Ct
- 301 Explorer Dr
- 1304 Silver Point Rd
- 319 Sienna Dr
- 371 Explorer Dr
- 384 Explorer Dr
- 379 Explorer Dr
- 118 Signal Ln
- 0 Johnson Marina Rd Unit 539063
- 869 Sunseeker Dr
- 873 Sunseeker Dr
- 818 Sunseeker Dr
- 748 Moonsail Cir
- 200 Derrick Dr
- 102 Murray Point Ln
- 10 North Dr
- 101 Murray Point Ln
- 103 Murray Point Ln
- 1135 Old Rd
- 256 Murray Falls Ln
- 252 Murray Falls Ln
- 237 Murray Falls Ln
- 234 Murray Falls Ln
- 104 Murray Point Ln
- 1117 Wonder Dr
- 105 Murray Point Ln
- 106 Murray Point Ln
- 1125 Wonder Dr
- 1139 Old Rd
- 1139 Old Rd
- 107 Murray Point Ln
- 1131 Old Rd
- 1133 Wonder Dr
- 108 Murray Point Ln
Your Personal Tour Guide
Ask me questions while you tour the home.