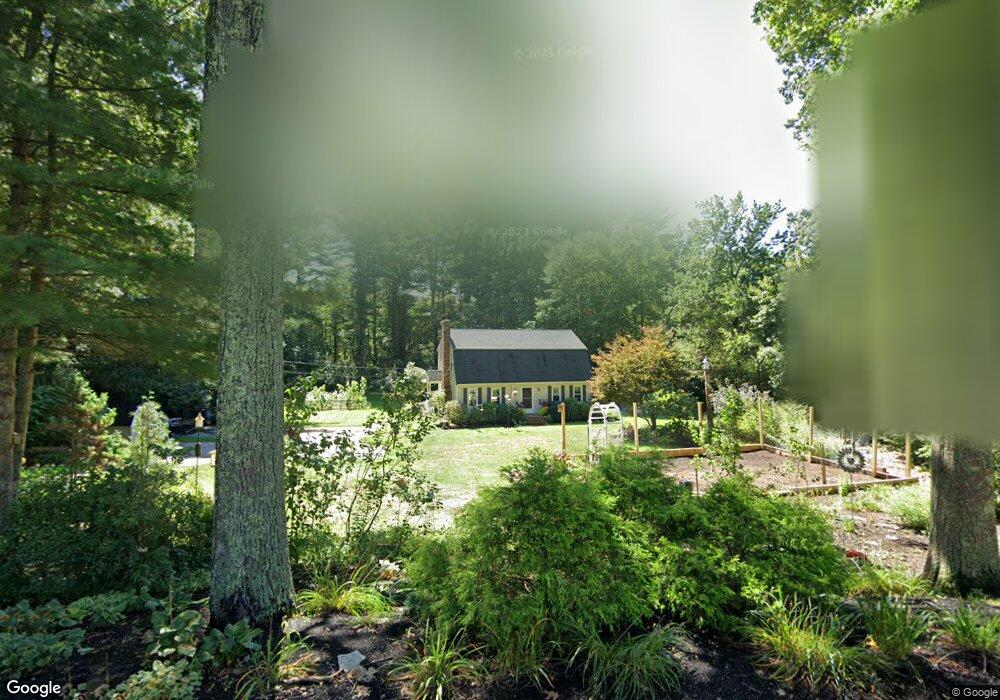
100 Myrtle St Wrentham, MA 02093
Estimated Value: $638,000 - $925,000
3
Beds
2
Baths
1,786
Sq Ft
$404/Sq Ft
Est. Value
About This Home
This home is located at 100 Myrtle St, Wrentham, MA 02093 and is currently estimated at $721,045, approximately $403 per square foot. 100 Myrtle St is a home located in Norfolk County with nearby schools including Delaney Elementary School, Charles E Roderick, and Foxborough Regional Charter School.
Ownership History
Date
Name
Owned For
Owner Type
Purchase Details
Closed on
Aug 20, 2025
Sold by
Healy David C and Healy Marlene K
Bought by
Healy Ft and Healy
Current Estimated Value
Purchase Details
Closed on
Oct 31, 1989
Sold by
Martello Mark H
Bought by
Ritucci John A
Home Financials for this Owner
Home Financials are based on the most recent Mortgage that was taken out on this home.
Original Mortgage
$125,000
Interest Rate
9.94%
Mortgage Type
Purchase Money Mortgage
Create a Home Valuation Report for This Property
The Home Valuation Report is an in-depth analysis detailing your home's value as well as a comparison with similar homes in the area
Home Values in the Area
Average Home Value in this Area
Purchase History
| Date | Buyer | Sale Price | Title Company |
|---|---|---|---|
| Healy Ft | -- | -- | |
| Ritucci John A | $177,500 | -- | |
| Ritucci John A | $177,500 | -- |
Source: Public Records
Mortgage History
| Date | Status | Borrower | Loan Amount |
|---|---|---|---|
| Previous Owner | Ritucci John A | $257,000 | |
| Previous Owner | Ritucci John A | $212,500 | |
| Previous Owner | Ritucci John A | $137,750 | |
| Previous Owner | Ritucci John A | $125,000 |
Source: Public Records
Tax History Compared to Growth
Tax History
| Year | Tax Paid | Tax Assessment Tax Assessment Total Assessment is a certain percentage of the fair market value that is determined by local assessors to be the total taxable value of land and additions on the property. | Land | Improvement |
|---|---|---|---|---|
| 2025 | $6,257 | $539,900 | $302,700 | $237,200 |
| 2024 | $6,088 | $507,300 | $302,700 | $204,600 |
| 2023 | $5,998 | $475,300 | $275,100 | $200,200 |
| 2022 | $5,849 | $427,900 | $256,600 | $171,300 |
| 2021 | $5,521 | $392,400 | $224,000 | $168,400 |
| 2020 | $5,339 | $374,700 | $199,200 | $175,500 |
| 2019 | $5,291 | $374,700 | $199,200 | $175,500 |
| 2018 | $5,069 | $356,000 | $199,400 | $156,600 |
| 2017 | $4,785 | $335,800 | $195,600 | $140,200 |
| 2016 | $4,612 | $323,000 | $189,900 | $133,100 |
| 2015 | $4,487 | $299,500 | $182,600 | $116,900 |
| 2014 | $3,965 | $259,000 | $146,400 | $112,600 |
Source: Public Records
Map
Nearby Homes
- 65 Pond St
- 362 East St
- 483 Thurston St
- 1 Lorraine Metcalf Dr
- 120 Hawes St
- 270 Dedham St
- 25 Foxboro Rd
- 10 Nature View Dr
- 15 Nature View Dr
- 319 Taunton St
- 11 Goodwin Dr
- 11 Earle Stewart Ln
- 131 Creek St Unit 7
- 7 Hill St Unit 10
- Lot 3 - 14 Earle Stewart Ln
- Lot 1 - Blueberry 2 Car Plan at King Philip Estates
- Lot 8 - Blueberry 2 Car Plan at King Philip Estates
- Lot 5 - Hughes 2 car Plan at King Philip Estates
- Lot 6 - Blueberry 3 Car Plan at King Philip Estates
- Lot 2 - Camden 2 Car Plan at King Philip Estates