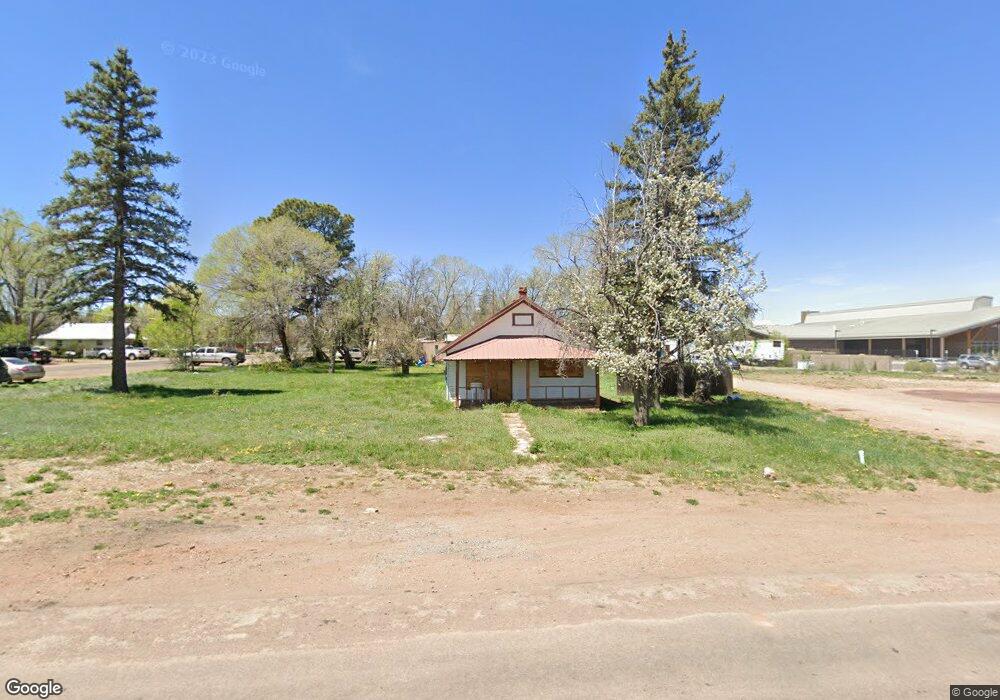
100 N 11th St Show Low, AZ 85901
Estimated Value: $323,709 - $373,000
Studio
--
Bath
1,811
Sq Ft
$188/Sq Ft
Est. Value
About This Home
This home is located at 100 N 11th St, Show Low, AZ 85901 and is currently estimated at $340,177, approximately $187 per square foot. 100 N 11th St is a home located in Navajo County with nearby schools including Nikolaus Homestead Elementary School, Show Low High School, and Show Low Junior High School.
Ownership History
Date
Name
Owned For
Owner Type
Purchase Details
Closed on
Nov 20, 2020
Sold by
Kisner James C and Kisner Karen A
Bought by
Wyrick Kristopher Evan and Wyrick Rebecca Sue
Current Estimated Value
Home Financials for this Owner
Home Financials are based on the most recent Mortgage that was taken out on this home.
Original Mortgage
$170,100
Outstanding Balance
$151,091
Interest Rate
2.7%
Mortgage Type
New Conventional
Estimated Equity
$189,086
Purchase Details
Closed on
Jul 31, 2006
Sold by
Amhc Llc
Bought by
Kisner James C and Kisner Karen A
Home Financials for this Owner
Home Financials are based on the most recent Mortgage that was taken out on this home.
Original Mortgage
$132,800
Interest Rate
6.3%
Mortgage Type
New Conventional
Create a Home Valuation Report for This Property
The Home Valuation Report is an in-depth analysis detailing your home's value as well as a comparison with similar homes in the area
Purchase History
| Date | Buyer | Sale Price | Title Company |
|---|---|---|---|
| Wyrick Kristopher Evan | $189,000 | Pioneer Title | |
| Kisner James C | $166,000 | First American Title |
Source: Public Records
Mortgage History
| Date | Status | Borrower | Loan Amount |
|---|---|---|---|
| Open | Wyrick Kristopher Evan | $170,100 | |
| Previous Owner | Kisner James C | $132,800 |
Source: Public Records
Tax History
| Year | Tax Paid | Tax Assessment Tax Assessment Total Assessment is a certain percentage of the fair market value that is determined by local assessors to be the total taxable value of land and additions on the property. | Land | Improvement |
|---|---|---|---|---|
| 2026 | $1,463 | -- | -- | -- |
| 2025 | $1,440 | $24,590 | $1,959 | $22,631 |
| 2024 | $1,363 | $24,552 | $1,959 | $22,593 |
| 2023 | $1,440 | $19,470 | $1,652 | $17,818 |
| 2022 | $1,363 | $0 | $0 | $0 |
| 2021 | $1,364 | $0 | $0 | $0 |
| 2020 | $1,281 | $0 | $0 | $0 |
| 2019 | $1,278 | $0 | $0 | $0 |
| 2018 | $1,219 | $0 | $0 | $0 |
| 2017 | $1,126 | $0 | $0 | $0 |
| 2016 | $1,109 | $0 | $0 | $0 |
| 2015 | $1,042 | $8,575 | $1,376 | $7,199 |
Source: Public Records
Map
Nearby Homes
- 201 S 6th Place
- 1381 E Malapai Rd
- 380 N 18th Place
- 720 S Reynolds Ln
- 500 E Adams
- 250 Timber Ridge Loop
- 0 S 8th St Unit D
- 0 S 8th St Unit B 6917977
- 40 Timber Ridge Loop
- 840 E Blue Jay
- 840 E Black Bear
- 430 Timber Ridge Loop
- 1420 E Meadow View Place
- 521 S Rockcreek Dr
- 140 W Nikolaus
- 2220 E Rockgarden Ln
- 531 S Mountain Pines Ave
- 2040 E Bluff Ridge Rd
- 2060 E Bluff Ridge Rd
- 661 S Creekside Dr