Estimated Value: $224,000 - $233,000
2
Beds
1
Bath
1,212
Sq Ft
$189/Sq Ft
Est. Value
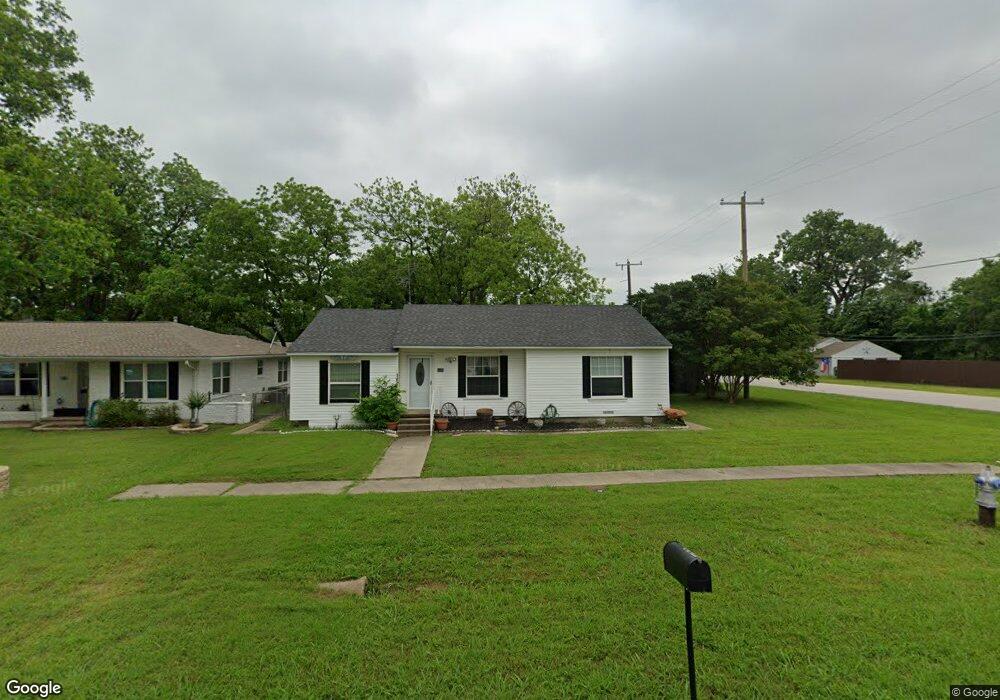
About This Home
This home is located at 100 N 4th St, Wylie, TX 75098 and is currently estimated at $228,584, approximately $188 per square foot. 100 N 4th St is a home located in Collin County with nearby schools including R F Hartman Elementary School, AB Harrison Intermediate School, and Grady Burnett J High School.
Ownership History
Date
Name
Owned For
Owner Type
Purchase Details
Closed on
May 9, 2025
Sold by
Miller Stinson James
Bought by
Miller Orpha Louise and Miller Orphia Louise
Current Estimated Value
Purchase Details
Closed on
Jan 23, 2019
Sold by
Kiser Lance and Talley Shayla
Bought by
Findley Rene and Miller Stinson
Purchase Details
Closed on
Dec 16, 2010
Sold by
Housewright Jo Ann Barbara and Crawford Belinda Ann
Bought by
Kiser Lance and Talley Shayla
Home Financials for this Owner
Home Financials are based on the most recent Mortgage that was taken out on this home.
Original Mortgage
$62,176
Interest Rate
4.24%
Mortgage Type
Purchase Money Mortgage
Purchase Details
Closed on
Apr 16, 2008
Sold by
Housewright Jo Ann Barbara
Bought by
Housewright Jo Ann Barbara
Create a Home Valuation Report for This Property
The Home Valuation Report is an in-depth analysis detailing your home's value as well as a comparison with similar homes in the area
Home Values in the Area
Average Home Value in this Area
Purchase History
| Date | Buyer | Sale Price | Title Company |
|---|---|---|---|
| Miller Orpha Louise | -- | None Listed On Document | |
| Findley Rene | -- | None Available | |
| Kiser Lance | -- | Lawyers Title | |
| Housewright Jo Ann Barbara | -- | None Available |
Source: Public Records
Mortgage History
| Date | Status | Borrower | Loan Amount |
|---|---|---|---|
| Previous Owner | Kiser Lance | $62,176 |
Source: Public Records
Tax History Compared to Growth
Tax History
| Year | Tax Paid | Tax Assessment Tax Assessment Total Assessment is a certain percentage of the fair market value that is determined by local assessors to be the total taxable value of land and additions on the property. | Land | Improvement |
|---|---|---|---|---|
| 2025 | $4,074 | $205,198 | $80,750 | $124,448 |
| 2024 | $4,074 | $206,292 | $76,000 | $130,292 |
| 2023 | $4,074 | $207,488 | $66,500 | $140,988 |
| 2022 | $4,398 | $200,483 | $57,000 | $143,483 |
| 2021 | $3,417 | $145,208 | $52,250 | $92,958 |
| 2020 | $2,869 | $115,561 | $38,000 | $77,561 |
| 2019 | $2,868 | $109,124 | $38,000 | $84,218 |
| 2018 | $2,672 | $99,204 | $38,000 | $95,658 |
| 2017 | $2,429 | $108,689 | $28,500 | $80,189 |
| 2016 | $2,278 | $82,050 | $13,300 | $68,750 |
| 2015 | $929 | $77,579 | $13,300 | $64,279 |
Source: Public Records
Map
Nearby Homes
- 104 N 5th St
- 301 S 3rd St
- 1022 Debby Ct
- 300 Woodhollow Ct
- 207 Spence Dr
- 306 Woodhollow Ct
- 303 N 2nd St
- 104 Rushcreek Dr
- 114 Liberty Dr
- 327 S 4th St
- 329 S 2nd St
- 416 Dogwood Dr
- 216 Cedar Ridge St
- 820 Foxwood Ln
- 811 Forest Edge Ln
- 825 Foxwood Ln
- 111 N Keefer Dr
- 414 Briarwood Dr
- 304 Hawthorn Dr
- 702 S Ballard Ave
- 102 S 4th St
- 102 N 4th St
- 101 S 4th St
- 501 E Oak St
- 103 S 4th St
- 105 N 5th St
- 1-10 Lots-
- Lot 1-5 Tbd
- 502 E Oak St
- 113 N 5th St
- 105 S 4th St
- 104 S 4th St
- 100 N 5th St
- 100 N 5th St
- 100 N 5th St Unit 1204
- 100 N 5th St Unit 1103
- 100 N 5th St Unit 1104
- 100 N 5th St Unit 1303
- 100 N 5th St Unit 1304
- 100 N 5th St Unit 1203