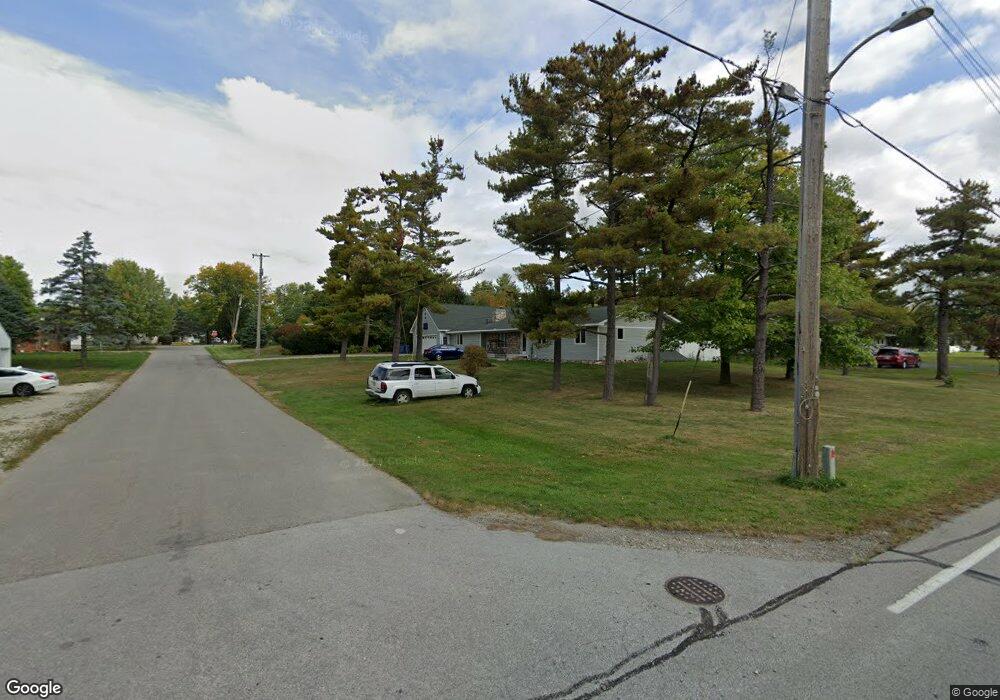
100 N Baum St Fremont, IN 46737
Estimated Value: $288,000 - $354,162
3
Beds
3
Baths
3,440
Sq Ft
$93/Sq Ft
Est. Value
About This Home
This home is located at 100 N Baum St, Fremont, IN 46737 and is currently estimated at $320,541, approximately $93 per square foot. 100 N Baum St is a home located in Steuben County with nearby schools including Fremont Elementary School, Fremont Middle School, and Fremont High School.
Ownership History
Date
Name
Owned For
Owner Type
Purchase Details
Closed on
May 16, 2022
Sold by
Lensky Christopher A
Bought by
Payton Tyler L
Current Estimated Value
Purchase Details
Closed on
Jun 8, 2009
Sold by
Lensky Nicole L
Bought by
Lensky Christopher A
Purchase Details
Closed on
Mar 2, 2007
Sold by
Lensky Christopher A
Bought by
Lensky Christopher A and Lensky Nicole L
Purchase Details
Closed on
May 21, 2001
Sold by
Lensky Christopher A
Bought by
Lensky Christopher A and Lensky Nicole Fishe
Purchase Details
Closed on
May 15, 2001
Sold by
Long Jennifer A
Bought by
Lensky Christopher A
Purchase Details
Closed on
Nov 15, 2000
Sold by
Kaiser Jack J
Bought by
Long Jennifer A
Purchase Details
Closed on
Mar 13, 1997
Sold by
Conforti Joseph F and Conforti Angela L
Bought by
Kaiser Jack J
Create a Home Valuation Report for This Property
The Home Valuation Report is an in-depth analysis detailing your home's value as well as a comparison with similar homes in the area
Home Values in the Area
Average Home Value in this Area
Purchase History
| Date | Buyer | Sale Price | Title Company |
|---|---|---|---|
| Payton Tyler L | $154,500 | Fidelity National Title Compan | |
| Lensky Christopher A | -- | Burns Law Office | |
| Lensky Christopher A | -- | None Available | |
| Lensky Christopher A | -- | None Available | |
| Lensky Christopher A | -- | -- | |
| Lensky Christopher A | $122,840 | -- | |
| Long Jennifer A | $116,500 | -- | |
| Kaiser Jack J | $115,000 | -- |
Source: Public Records
Tax History Compared to Growth
Tax History
| Year | Tax Paid | Tax Assessment Tax Assessment Total Assessment is a certain percentage of the fair market value that is determined by local assessors to be the total taxable value of land and additions on the property. | Land | Improvement |
|---|---|---|---|---|
| 2024 | $4,183 | $294,000 | $27,400 | $266,600 |
| 2023 | $4,194 | $283,100 | $26,100 | $257,000 |
| 2022 | $2,137 | $269,700 | $24,300 | $245,400 |
| 2021 | $1,907 | $240,800 | $23,600 | $217,200 |
| 2020 | $1,816 | $228,700 | $22,500 | $206,200 |
| 2019 | $1,610 | $208,500 | $22,500 | $186,000 |
| 2018 | $1,647 | $204,300 | $24,700 | $179,600 |
| 2017 | $1,477 | $188,000 | $24,700 | $163,300 |
| 2016 | $1,334 | $181,600 | $24,700 | $156,900 |
| 2014 | $1,155 | $182,000 | $24,700 | $157,300 |
| 2013 | $1,155 | $183,700 | $24,700 | $159,000 |
Source: Public Records
Map
Nearby Homes
- 304 Hardy St
- TBD Indiana 120
- 200 Michael St
- 506 S Broad St
- TBD Evans Dr
- 603 W Follett Ln
- 6405 N 300 E
- 00 N 300 Rd E
- 406 Prairie Ln
- 50 Janedale Dr
- 3217 E 700 N
- 1000 W Toledo St
- 913 W Cora Ln
- 1001 Nicholas Trail
- 00 W Toledo St
- 1000 Nicholas Trail
- 380 Schaeffer Ct Fish Lake
- 815 Cherry Hill Ct
- TBD Gerald Lett Unit 1
- 115 355 Ln
- 000 Baum St
- 700 E Spring St
- 703 E Toledo St
- 606 E Spring St
- 700 E Toledo St
- 606 E Toledo St
- 702 E Toledo St
- 605 E Toledo St
- 704 E Spring St
- 604 E Toledo St
- 602 E Spring St
- 706 E Toledo St
- 701 E Spring St
- 607 E Spring St
- 706 E Spring St
- 104 S Baum St
- 107 S Baum St
- 600 E Toledo St
- 605 E Albion St
- 600 E Spring St