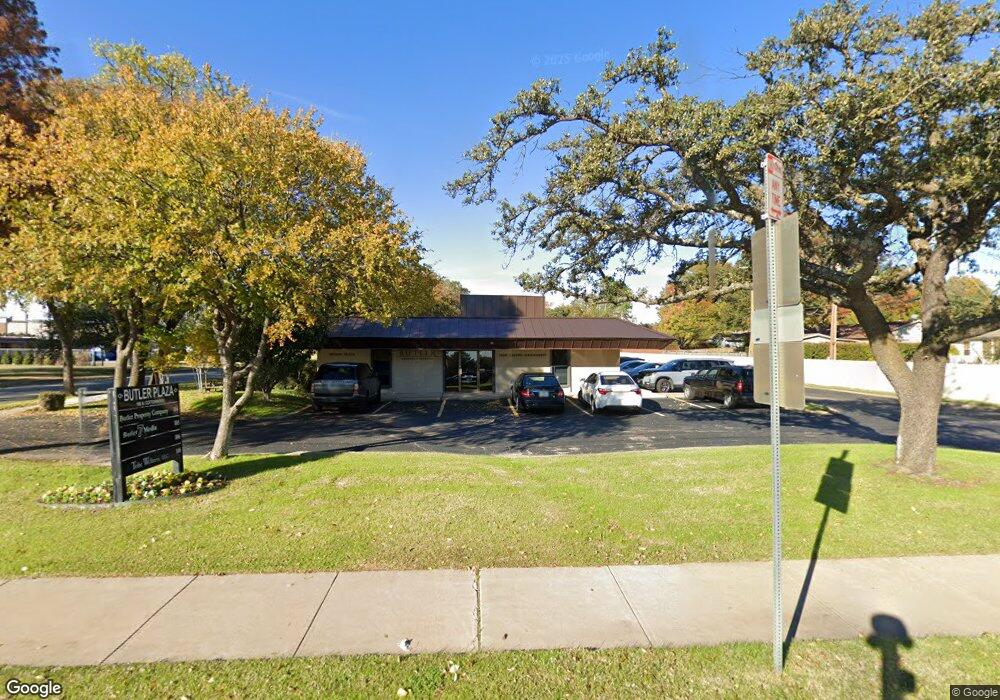
100 N Cottonwood Dr Unit 106 Richardson, TX 75080
Richardson Heights Neighborhood
--
Bed
--
Bath
4,320
Sq Ft
0.5
Acres
About This Home
This home is located at 100 N Cottonwood Dr Unit 106, Richardson, TX 75080. 100 N Cottonwood Dr Unit 106 is a home located in Dallas County with nearby schools including Arapaho Classical Magnet School, Richardson West Jr. High School, and Richardson High School.
Ownership History
Date
Name
Owned For
Owner Type
Purchase Details
Closed on
May 3, 2022
Sold by
John Dodson
Bought by
Patel Hansaben
Purchase Details
Closed on
Jul 18, 2016
Sold by
Realcorp Lp
Bought by
100 Cottonwood Llc
Purchase Details
Closed on
Apr 13, 2012
Sold by
Bbt Corp
Bought by
Realcorp Lp
Home Financials for this Owner
Home Financials are based on the most recent Mortgage that was taken out on this home.
Original Mortgage
$200,000
Interest Rate
3.92%
Mortgage Type
Future Advance Clause Open End Mortgage
Purchase Details
Closed on
Apr 12, 2012
Sold by
Bbt Corp
Bought by
Realcorp Lp
Home Financials for this Owner
Home Financials are based on the most recent Mortgage that was taken out on this home.
Original Mortgage
$200,000
Interest Rate
3.92%
Mortgage Type
Future Advance Clause Open End Mortgage
Purchase Details
Closed on
Aug 19, 1994
Sold by
Burnett Billye Lana Hurtig and Hillman Jana Lynn Hurtig
Bought by
Bbt Corp
Create a Home Valuation Report for This Property
The Home Valuation Report is an in-depth analysis detailing your home's value as well as a comparison with similar homes in the area
Home Values in the Area
Average Home Value in this Area
Purchase History
| Date | Buyer | Sale Price | Title Company |
|---|---|---|---|
| Patel Hansaben | -- | None Listed On Document | |
| 100 Cottonwood Llc | -- | Chicago Title | |
| Realcorp Lp | -- | Ctot | |
| Realcorp Lp | -- | Ctot | |
| Bbt Corp | -- | -- |
Source: Public Records
Mortgage History
| Date | Status | Borrower | Loan Amount |
|---|---|---|---|
| Previous Owner | Realcorp Lp | $200,000 | |
| Previous Owner | Realcorp Lp | $200,000 |
Source: Public Records
Tax History Compared to Growth
Tax History
| Year | Tax Paid | Tax Assessment Tax Assessment Total Assessment is a certain percentage of the fair market value that is determined by local assessors to be the total taxable value of land and additions on the property. | Land | Improvement |
|---|---|---|---|---|
| 2025 | $8,345 | $382,730 | $173,010 | $209,720 |
| 2024 | $8,345 | $382,730 | $173,010 | $209,720 |
| 2023 | $8,345 | $382,730 | $173,010 | $209,720 |
| 2022 | $9,358 | $382,730 | $173,010 | $209,720 |
| 2021 | $8,922 | $340,200 | $173,010 | $167,190 |
| 2020 | $9,082 | $340,200 | $0 | $0 |
| 2019 | $8,405 | $300,000 | $173,010 | $126,990 |
| 2018 | $7,348 | $275,000 | $173,010 | $101,990 |
| 2017 | $6,942 | $260,000 | $173,010 | $86,990 |
| 2016 | $6,675 | $250,000 | $173,010 | $76,990 |
| 2015 | $6,598 | $250,000 | $173,010 | $76,990 |
| 2014 | $6,598 | $250,000 | $173,010 | $76,990 |
Source: Public Records
Map
Nearby Homes
- 106 Dublin Dr
- 300 N Cottonwood Dr
- 303 N Cottonwood Dr
- 1419 Stagecoach Dr
- 1427 Stagecoach Dr
- 506 S Cottonwood Dr
- 1309 Dumont Dr
- 602 Dublin Dr
- 1239 Dalhart Dr
- 1435 Dumont Dr
- 1218 Dalhart Dr
- 1226 Laurel Ln
- 1220 Dumont Dr
- 7739 Dentcrest Dr
- 1308 Magnolia Dr
- 14522 Overview Dr
- 7724 Meadowhaven Dr
- 821 Dublin Dr Unit 151
- 1220 Colfax Cir
- 14420 Overview Dr
- 100 N Cottonwood Dr Unit 108
- 100 N Cottonwood Dr
- 103 Brookwood Dr
- 105 Brookwood Dr
- 101 Brookwood Dr
- 107 Brookwood Dr
- 109 Brookwood Dr
- 111 Brookwood Dr
- 102 Brookwood Dr
- 112 N Cottonwood Dr
- 100 Brookwood Dr
- 104 Brookwood Dr
- 100 S Cottonwood Dr
- 106 Brookwood Dr
- 113 Brookwood Dr
- 108 Brookwood Dr
- 114 N Cottonwood Dr
- 115 Brookwood Dr
- 110 Brookwood Dr
- 115 N Cottonwood Dr