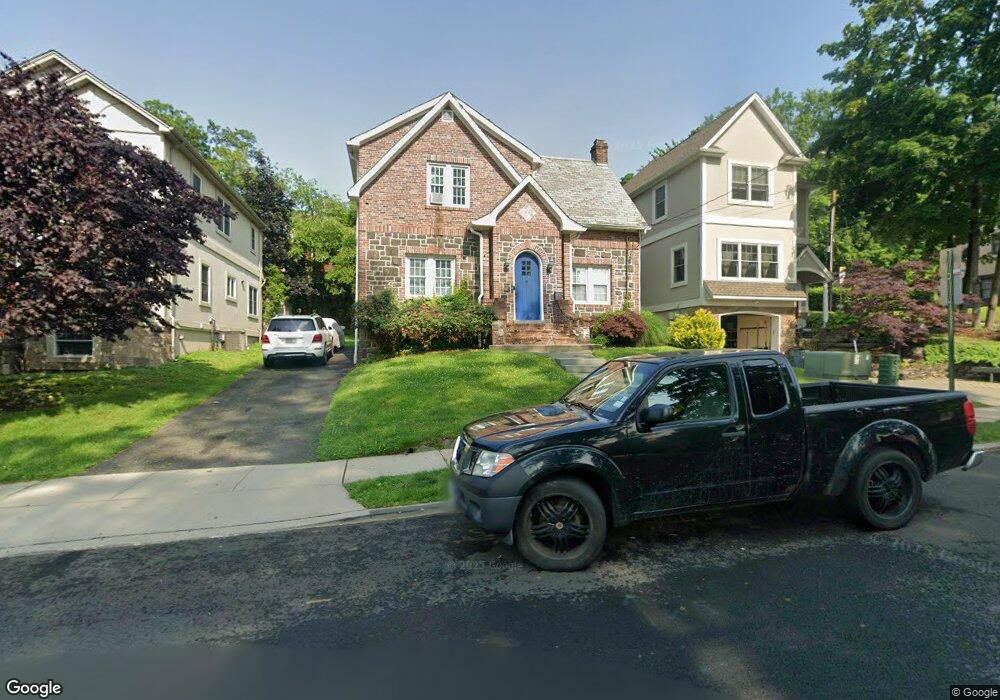
100 N Franklin St Nyack, NY 10960
Nyack Village NeighborhoodEstimated Value: $661,521 - $884,000
3
Beds
1
Bath
1,655
Sq Ft
$461/Sq Ft
Est. Value
About This Home
This home is located at 100 N Franklin St, Nyack, NY 10960 and is currently estimated at $763,380, approximately $461 per square foot. 100 N Franklin St is a home located in Rockland County with nearby schools including Nyack Senior High School and Blue Rock School.
Ownership History
Date
Name
Owned For
Owner Type
Purchase Details
Closed on
Aug 27, 2010
Sold by
Smk Homebuilders Inc
Bought by
Hiep Kenneth and Hiep Kenneth
Current Estimated Value
Purchase Details
Closed on
Aug 19, 2009
Sold by
Easter Scott A
Bought by
Keenan Sean M
Purchase Details
Closed on
Aug 19, 2008
Sold by
Easter Scott A and Kelly Mary Alison
Bought by
Keenan Frances and Keenan Sean M
Home Financials for this Owner
Home Financials are based on the most recent Mortgage that was taken out on this home.
Original Mortgage
$337,500
Interest Rate
5.19%
Purchase Details
Closed on
Oct 10, 2003
Sold by
Hezekiah Easter
Bought by
Scott Easter and Mary Kelly
Home Financials for this Owner
Home Financials are based on the most recent Mortgage that was taken out on this home.
Original Mortgage
$204,000
Interest Rate
5.6%
Mortgage Type
Purchase Money Mortgage
Create a Home Valuation Report for This Property
The Home Valuation Report is an in-depth analysis detailing your home's value as well as a comparison with similar homes in the area
Home Values in the Area
Average Home Value in this Area
Purchase History
| Date | Buyer | Sale Price | Title Company |
|---|---|---|---|
| Hiep Kenneth | $250,000 | Old Republic National Title | |
| Keenan Sean M | $450,500 | Robert S Knoebel | |
| Keenan Frances | $450,500 | None Available | |
| Scott Easter | $316,000 | -- | |
| Easter Scott A | $316,000 | Fidelity National Title Insu |
Source: Public Records
Mortgage History
| Date | Status | Borrower | Loan Amount |
|---|---|---|---|
| Previous Owner | Keenan Frances | $337,500 | |
| Previous Owner | Easter Scott A | $204,000 |
Source: Public Records
Tax History Compared to Growth
Tax History
| Year | Tax Paid | Tax Assessment Tax Assessment Total Assessment is a certain percentage of the fair market value that is determined by local assessors to be the total taxable value of land and additions on the property. | Land | Improvement |
|---|---|---|---|---|
| 2024 | $13,351 | $144,900 | $21,300 | $123,600 |
| 2023 | $13,351 | $144,900 | $21,300 | $123,600 |
| 2022 | $3,513 | $144,900 | $21,300 | $123,600 |
| 2021 | $11,603 | $144,900 | $21,300 | $123,600 |
| 2020 | $10,846 | $144,900 | $21,300 | $123,600 |
| 2019 | $3,248 | $144,900 | $21,300 | $123,600 |
| 2018 | $10,360 | $144,900 | $21,300 | $123,600 |
| 2017 | $10,198 | $144,900 | $21,300 | $123,600 |
| 2016 | $9,793 | $144,900 | $21,300 | $123,600 |
| 2015 | -- | $144,900 | $21,300 | $123,600 |
| 2014 | -- | $144,900 | $21,300 | $123,600 |
Source: Public Records
Map
Nearby Homes
- 100 High Ave
- 109 High Ave Unit 302
- 218 High Ave
- 101 1st Ave
- 153 High Ave
- 2 Francis Ave
- 4 Francis Ave
- 102 N Midland Ave
- 36 4th Ave
- 201 N Broadway
- 23 N Midland Ave
- 10 Prospect St
- 52 Gedney St
- 103 Gedney St Unit 3B
- 103 Gedney St Unit 5K
- 103 Gedney St Unit 1M
- 103 Gedney St Unit 2N
- 36 Summit St
- 3 Remsen St
- 260 High Ave
- 104 N Franklin St
- 94 N Franklin St
- 88 N Franklin St
- 2 Duryea Place Unit 3B
- 2 Duryea Place Unit 4A
- 2 Duryea Place Unit 1B
- 2 Duryea Place Unit 2B
- 2 Duryea Place Unit 1A
- 4 Duryea Place Unit 2B
- 2 Duryea Place Unit 2
- 2 Duryea Place Unit 4C
- 2 Duryea Place Unit 2C
- 6 Duryea Place Unit 1C
- 6 Duryea Place Unit 3C
- 6 Duryea Place Unit 2C
- 4 Duryea Place Unit 1B
- 2 Duryea Place Unit 3A
- 2 Duryea Place
- 114 N Franklin St
- 86 N Franklin St