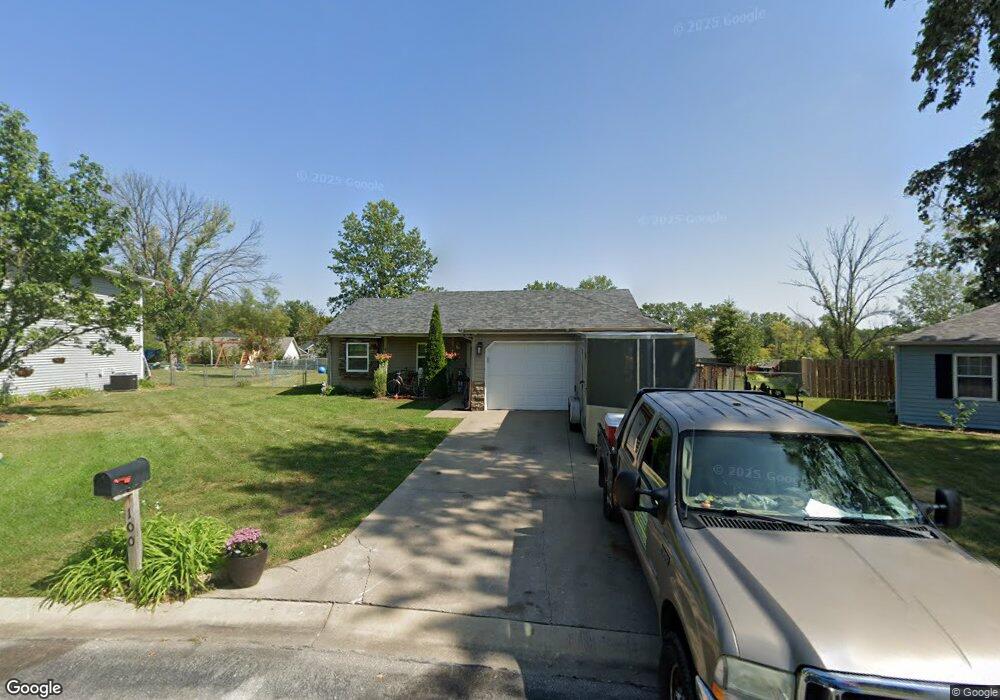
100 N Moonglow Ln Columbia, MO 65201
Estimated Value: $214,000 - $238,504
3
Beds
2
Baths
1,230
Sq Ft
$184/Sq Ft
Est. Value
About This Home
This home is located at 100 N Moonglow Ln, Columbia, MO 65201 and is currently estimated at $226,252, approximately $183 per square foot. 100 N Moonglow Ln is a home located in Boone County with nearby schools including Shepard Boulevard Elementary School, Oakland Middle School, and Muriel W. Battle High School.
Ownership History
Date
Name
Owned For
Owner Type
Purchase Details
Closed on
May 1, 2020
Sold by
Haskins Matthews Lauren Jean
Bought by
Henderson Lorenia and Henderson Shelby
Current Estimated Value
Home Financials for this Owner
Home Financials are based on the most recent Mortgage that was taken out on this home.
Original Mortgage
$117,000
Outstanding Balance
$106,218
Interest Rate
5.25%
Mortgage Type
New Conventional
Estimated Equity
$120,034
Purchase Details
Closed on
Feb 2, 2015
Sold by
Hopson Land & Cattle Llc
Bought by
Haskins Matthews Lauren Jean
Home Financials for this Owner
Home Financials are based on the most recent Mortgage that was taken out on this home.
Original Mortgage
$98,000
Interest Rate
3.83%
Mortgage Type
Future Advance Clause Open End Mortgage
Purchase Details
Closed on
Oct 20, 2014
Sold by
Cooper Mary A
Bought by
Hopson Land And Cattle Llc
Create a Home Valuation Report for This Property
The Home Valuation Report is an in-depth analysis detailing your home's value as well as a comparison with similar homes in the area
Purchase History
| Date | Buyer | Sale Price | Title Company |
|---|---|---|---|
| Henderson Lorenia | -- | Boone Central Title Company | |
| Haskins Matthews Lauren Jean | -- | Boone Central Title Co | |
| Hopson Land And Cattle Llc | -- | None Available |
Source: Public Records
Mortgage History
| Date | Status | Borrower | Loan Amount |
|---|---|---|---|
| Open | Henderson Lorenia | $117,000 | |
| Previous Owner | Haskins Matthews Lauren Jean | $98,000 |
Source: Public Records
Tax History
| Year | Tax Paid | Tax Assessment Tax Assessment Total Assessment is a certain percentage of the fair market value that is determined by local assessors to be the total taxable value of land and additions on the property. | Land | Improvement |
|---|---|---|---|---|
| 2025 | $1,690 | $24,035 | $2,888 | $21,147 |
| 2024 | $1,580 | $21,850 | $2,888 | $18,962 |
| 2023 | $1,567 | $21,850 | $2,888 | $18,962 |
| 2022 | $1,450 | $20,235 | $2,888 | $17,347 |
| 2021 | $1,452 | $20,235 | $2,888 | $17,347 |
| 2020 | $1,424 | $18,734 | $2,888 | $15,846 |
| 2019 | $1,424 | $18,734 | $2,888 | $15,846 |
| 2018 | $1,327 | $0 | $0 | $0 |
| 2017 | $1,312 | $17,347 | $2,888 | $14,459 |
| 2016 | $1,310 | $17,347 | $2,888 | $14,459 |
| 2015 | $1,210 | $17,347 | $2,888 | $14,459 |
| 2014 | $1,213 | $17,347 | $2,888 | $14,459 |
Source: Public Records
Map
Nearby Homes
- 255 N Luna Ln
- 60 N Broadview Ct
- 61 N Broadview Ct
- 7680 E Parklane Dr
- 9830 Interstate 70 Dr SE
- LOT 104 Portcrawl Dr
- LOT 105 Portcrawl Dr
- 6512 Portcrawl Dr
- LOT 119 Burnhill Dr
- LOT 125 Burnhill Dr
- 0 E St Charles Rd Unit 431486
- 0 E St Charles Rd Unit 415697
- 6521 Cromford Ln
- 6504 Walsby Dr
- LOT 149 Cromford Ln
- LOT 146 Cromford Ln
- LOT 148 Cromford Ln
- 6505 Cromford Ln
- LOT 167 Adare Manor Dr
- LOT 165 Castle Stuart Ct
- 80 N Moonglow Ln
- 120 N Moonglow Ln
- 105 N Luna Ln
- 125 N Luna Ln
- LOT 10 Luna Ln
- 85 N Luna Ln
- 145 N Luna Ln
- 55 N Luna Ln
- 140 N Moonglow Ln
- LOT 12 Luna Ln
- LOT 11 Luna Ln
- 60 N Moonglow Ln
- 41 N Moonglow Ln
- LOT 8 Luna Ln
- LOT 22 N Luna Ln
- LOT 27 N Luna Ln
- LOT 26 N Luna Ln
- LOT 23 N Luna Ln
- LOT 20 N Luna Ln
- LOT 19 N Luna Ln
Your Personal Tour Guide
Ask me questions while you tour the home.