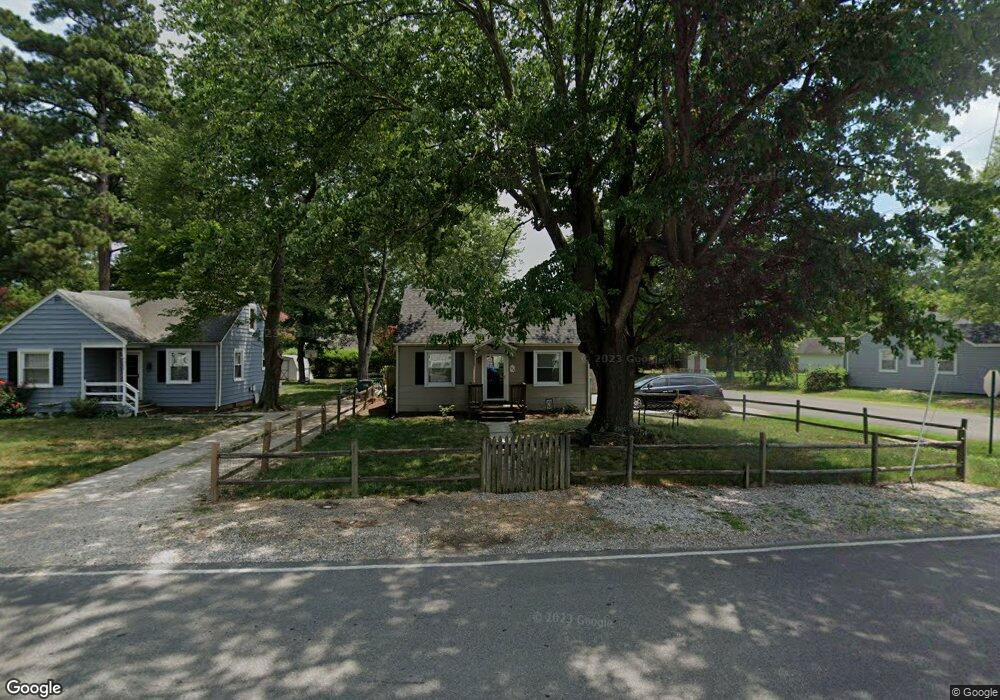
100 Naglee Ave Sandston, VA 23150
Estimated Value: $211,000 - $251,000
3
Beds
1
Bath
880
Sq Ft
$257/Sq Ft
Est. Value
About This Home
This home is located at 100 Naglee Ave, Sandston, VA 23150 and is currently estimated at $225,728, approximately $256 per square foot. 100 Naglee Ave is a home located in Henrico County with nearby schools including Sandston Elementary School, Elko Middle School, and Highland Springs High School.
Ownership History
Date
Name
Owned For
Owner Type
Purchase Details
Closed on
Nov 12, 1999
Sold by
Colyar Tammy K
Bought by
Alexander Michael W
Current Estimated Value
Home Financials for this Owner
Home Financials are based on the most recent Mortgage that was taken out on this home.
Original Mortgage
$62,900
Outstanding Balance
$19,100
Interest Rate
7.68%
Mortgage Type
New Conventional
Estimated Equity
$206,628
Purchase Details
Closed on
Jul 10, 1997
Sold by
Colyar Jason T and Colyar K
Bought by
Colyar Tammy K
Create a Home Valuation Report for This Property
The Home Valuation Report is an in-depth analysis detailing your home's value as well as a comparison with similar homes in the area
Home Values in the Area
Average Home Value in this Area
Purchase History
| Date | Buyer | Sale Price | Title Company |
|---|---|---|---|
| Alexander Michael W | $74,000 | -- | |
| Colyar Tammy K | -- | -- |
Source: Public Records
Mortgage History
| Date | Status | Borrower | Loan Amount |
|---|---|---|---|
| Open | Colyar Tammy K | $62,900 |
Source: Public Records
Tax History Compared to Growth
Tax History
| Year | Tax Paid | Tax Assessment Tax Assessment Total Assessment is a certain percentage of the fair market value that is determined by local assessors to be the total taxable value of land and additions on the property. | Land | Improvement |
|---|---|---|---|---|
| 2025 | $1,653 | $172,500 | $41,000 | $131,500 |
| 2024 | $1,653 | $159,200 | $39,000 | $120,200 |
| 2023 | $1,358 | $159,200 | $39,000 | $120,200 |
| 2022 | $1,078 | $132,600 | $37,000 | $95,600 |
| 2021 | $1,018 | $111,800 | $33,000 | $78,800 |
| 2020 | $976 | $111,800 | $33,000 | $78,800 |
| 2019 | $945 | $108,200 | $31,000 | $77,200 |
| 2018 | $890 | $101,900 | $31,000 | $70,900 |
| 2017 | $834 | $95,500 | $31,000 | $64,500 |
| 2016 | $807 | $92,400 | $31,000 | $61,400 |
| 2015 | $798 | $92,400 | $31,000 | $61,400 |
| 2014 | $798 | $91,400 | $31,000 | $60,400 |
Source: Public Records
Map
Nearby Homes